Operations | Monitoring | ITSM | DevOps | Cloud

Dashboards

How Grafana Labs is reorganizing for growth

As you most likely know, Grafana Labs is growing. Growing like crazy! As Goutham Veeramachaneni noted in his blog post, “~30 people in March 2018 and now, in August 2020 we’re 180+ people. That is 6x growth in 2.5 years.” And we have no intention of slowing that growth. Matter of fact, we’re hiring as quickly as we can — and on top of that keep hiring specialists just to scale out hiring even more.

How to maximize the value of SCOM - Monitoring, Alerts, Incidents & Visualization

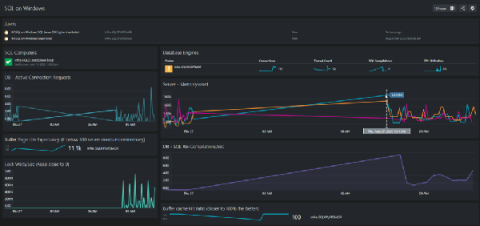
In SCOM you can see the monitoring that generates your alerts (the contents of Health Explorer). While SCOM doesn’t always make it easy to get at the valuable context that this monitoring data provides, it is there and can help answer the "why" questions that often come up when looking at an alert in isolation.

How To 'Translate' Grafana Dashboards from Graphite to Elasticsearch

Grafana is the de facto open source tool for visualizing metrics. Grafana supports many different backends for data sources and handles each one slightly differently. This blog post is geared towards helping convert Grafana dashboards from using the Graphite backend to using Elasticsearch as a metrics datasource. There are many similarities between how to use both as datasources and how to plot graphs around them, but there are also many differences that need to be accounted for.

Take a peek inside the latest version of the Dynatrace Enterprise plugin for Grafana

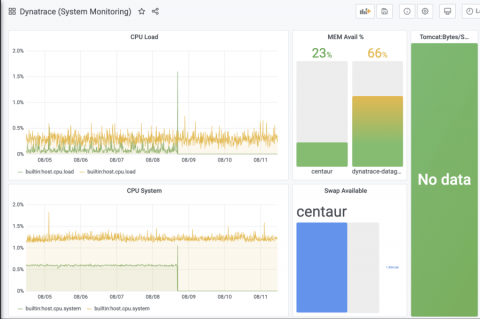
Hi, everyone! In honor of bingeing every season of Community over the last few weeks, Eldin and Christine have been inspired to rebrand ourselves as none other than our other favorite dynamic duo, Troy and Abed! Yet, instead of singing “Troy and Abed in the morning,” we are back to write about some useful improvements we’ve made to our Enterprise Dynatrace plugin.

Bring new insights to your IP analytics with a global administrative layer in Elastic Maps

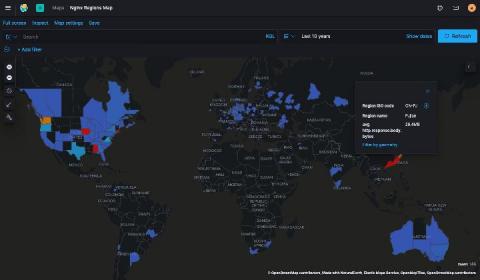
We love maps at Elastic. In the Elastic Stack, there is one core component of all data we visualize using maps: Location. Location can mean reporting real-time positions of fleet vehicles, using a geofence for limiting search results, gauging application performance metrics from a geographic area, or identifying security threats by attaching geographic coordinates to IP addresses.

I Can See Clearly Now: Dashboarding and Multi I/O as Spring Cloud Data Flow for Kubernetes 1.1 Goes GA

Spring Cloud Data Flow (SCDF) for Kubernetes 1.1 is now generally available, building on the open source SCDF version 2.6 released in August. The Kubernetes-based commercial offering leverages Tanzu Observability by Wavefront for dashboarding and observability, and enables developers to take their data pipelines to the next level with the introduction of Multi I/O for event-streaming applications.

How we're improving backfill methods to get older data into Prometheus

A few weeks ago, I teamed up with Bartek Plotka, a principal software engineer at Red Hat, for a deep-dive session on Prometheus at KubeCon + CloudNativeCon EU. We covered a lot of topics, with highlights that included scaling Prometheus, remote-write and metadata. We ended the talk with a quick demo on how to import data from CSV files into Prometheus. I want to use this blog post to provide more insight into the state of backfill in Prometheus.

KubeCon + CloudNativeCon EU recap: What you need to know about OpenMetrics

Before Prometheus, the closest thing to a common standard for metrics was Simple Network Management Protocol (SNMP), the internet standard protocol for collecting and organizing information and monitoring networks. Front and center in SNMP is ASN1, which lacks modern design and comes with trade-offs that made sense in the past but not so much today. Aside from that, many of the existing protocols were chatty and slow as well as proprietary, very hard to implement, or both.

Bold, insightful, real-time: Visualizing APM data with Canvas in Kibana

Since we launched Canvas in 2018, we have seen tons of our users create beautiful dashboards that tell stories with Elasticsearch data. In the spirit of making it even easier to get started, we are creating templates that you can import and get instantly beautiful dashboards for all the data the Elastic Stack captures.