Operations | Monitoring | ITSM | DevOps | Cloud

Dashboards

Observing Kubernetes: Lessons learned building, managing & monitoring cloud native systems

This talk covers experience and thoughts about how to approach the monitoring and management of cloud-native systems. It will draw both from observations of the opportunities provided by systems like Kubernetes as well as from practical hands-on experience from building real monitoring systems. With luck it will provide both experiences from the past, and inspirations for the future.

Sensu Check Metric Extraction with InfluxDB and Grafana

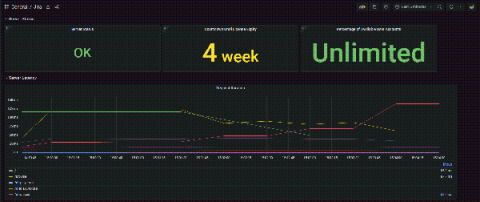
Nikki Attea talks about one of the endless permutations of metrics software you can pair with Sensu. She'll show you how to collect data using Sensu check output metric extraction, transform that data with a Sensu InfluxDB Handler, store the data in an InfluxDB time series database and visualize that data on a Grafana dashboard.

What is Grafana? Let's see its history and how it is related to other software!

Grafana is an open source tool, with Apache 2.0 license, designed by Torkel Ödegaard (who is still in charge of its development and maintenance) and created in January 2014. This Swedish developer began his career in the .NET field and since 2012, until nowadays, he continues offering development and consulting services through this popular proprietary platform, while developing free software at the same time.