Operations | Monitoring | ITSM | DevOps | Cloud

Dashboards

Legacy alerting removal: What you need to know about upgrading to Grafana Alerting

Two years ago, when we launched Grafana 9, we announced the deprecation of legacy alerting and introduced Grafana Alerting, the new default alerting system in all editions of Grafana. Since then we have invested in Grafana Alerting, making it easier to create and manage your alerts. Along the way we have also worked to make the transition from legacy alerting to Grafana Alerting as seamless as possible in preparation for the time when we remove legacy alerting altogether from Grafana.

Creating alerts with Grafana | Grafana for Beginners Ep 11

When observing your data with Grafana, you don't need to be glued to your dashboard 24/7. Join Senior Developer Advocate, Lisa Jung to learn how to set up Grafana to keep an eye on your data and alert you if something needs your attention! The following are covered in this episode: ☁️ Grafana Cloud is the easiest way to get started with Grafana dashboards, metrics, logs, and traces. Our forever-free tier includes access to 10k metrics, 50GB logs, 50GB traces and more. We also have plans for every use case.

How the Prometheus community is investing in OpenTelemetry

Goutham Veeramachaneni, a product manager at Grafana Labs, and Carrie Edwards, a senior software engineer at Grafana Labs, are both contributors to the Prometheus open source project. This post, which they wrote together, was originally published on the Prometheus.io blog in March 2024. The OpenTelemetry project is an observability framework and toolkit designed to create and manage telemetry data such as traces, metrics, and logs.

Beginners guide - Visualizing Logs | Grafana

In this video, Grafana Developer Advocate Leandro Melendez describes the logs visualization panel, which shows log lines from data sources that support logs, such as Elastic, Influx, and Loki. Typically you would use this visualization next to a graph visualization to display the log output of a related process.

Simplified routing in Grafana Alerting: Easy, secure, and powerful

With great power comes great… complexity? When we introduced Grafana Alerting a few years ago, it included a powerful routing feature that teams could use to send alerts to various contact points. Unfortunately, this functionality also came with a fair bit of complexity and an unfamiliar UX. This prevented many users from adopting it, but we’re still big believers in how it can help users.

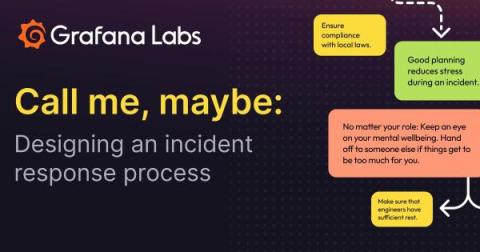
Call me, maybe: designing an incident response process

Hey, I just deployed — and this is crazy. But the server’s down, so call me, maybe? Making your services available at all times is the gold standard of modern software operations. The easiest way to reach this would be to just write bug-free software, but even if you reach this completely unattainable goal — stuff happens! Modern software rarely exists in a vacuum and often depends on a multitude of external services and libraries.

How to Configure a Histogram Visualization | Grafana

💡 Do you want to know how and when to use histogram visualizations? Join Senior Developer Advocate Marie Cruz in this beginner-friendly tutorial to learn how to configure a histogram visualization in Grafana. ☁️ Grafana Cloud is the easiest way to get started with Grafana dashboards, metrics, logs, and traces. Our forever-free tier includes access to 10k metrics, 50GB logs, 50GB traces and more.

How to automate image analysis with the ChatGPT vision API and Grafana Cloud Metrics

OpenAI’s ChatGPT has an extraordinary ability to process natural language, reason about a user’s prompts, and generate human-like conversation in response. However, as the saying goes, “a picture is worth a thousand words” — and perhaps an even more significant achievement is ChatGPT’s ability to understand and answer questions about images.

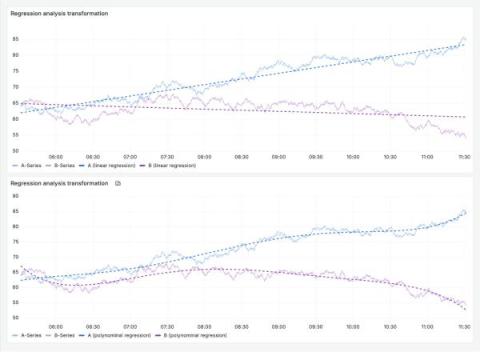
How to surface trends and make sense of your data with Grafana

There is a Polish proverb: “Co za dużo to niezdrowo,” which more or less translates to “Enough is as good as a feast.” (Or, translated verbatim: “Too much of something can be unhealthy.”) Sometimes this is true for data as well. At Grafana Labs, we’re always introducing products and features that help you make sense of that abundance of data, either by efficient visualizations, adaptive observability, or apps dedicated to specific workflows and use cases.

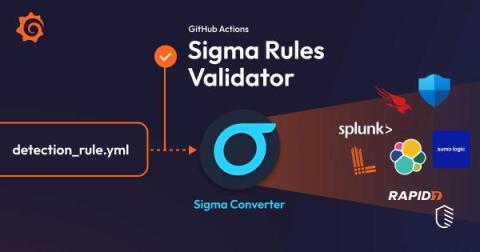
How to validate Sigma rules with GitHub Actions for improved security monitoring

Monitoring your identity provider’s logs is critical to identify potential security threats. These logs are vital for a security team, who may store them in a specialized tool like Grafana Loki for enhanced accessibility and analysis. The ability to pinpoint specific patterns within these logs is key — and by crafting these patterns into Loki queries, you can conduct focused searches across logs.