Operations | Monitoring | ITSM | DevOps | Cloud

Dashboards

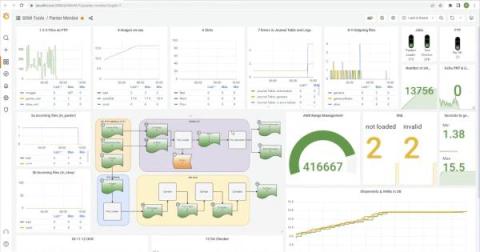
How shipping/third-party logistics companies reduce MTTR and increase uptime with the Grafana LGTM Stack

These days, everything can be tracked: transportation, deliveries, food orders. . . For consumers, knowing the location of a package or courier is a bonus, but for companies in the business of shipping, delivering, and third-party logistics, it’s a necessity. And so is having the right observability system to ensure everything gets where it needs to go. After all, errors, downtime, or anything that causes delays will end up delivering unhappy customers and lost revenue.

Deep Dive - Time Series Panel Visualizations: What Are They? How to Get Started? | Grafana

In this video, Grafana Developer Advocate Leandro Melendez describes Time series visualizations, the default and primary way to visualize time series data as a graph. They can render series as lines, points, or bars. They’re versatile enough to display almost any time-series data. — Found this video useful? Be sure to give it a thumbs up and subscribe to our channel for more helpful Grafana tutorial videos.

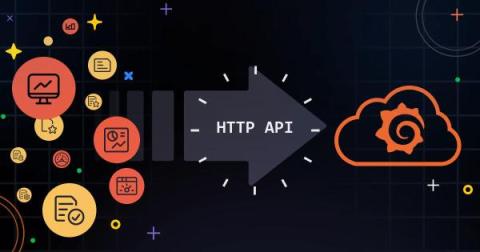
How to use HTTP APIs to send metrics and logs to Grafana Cloud

Integrating monitoring and logging into your application stack is crucial for maintaining performance, enhancing security, and streamlining troubleshooting. Grafana Cloud offers a robust solution for monitoring your applications by collecting metrics and logs using an agent, such as Grafana Agent, but there are many environments where this isn’t feasible.

OpenTelemetry distributed tracing with eBPF: What's new in Grafana Beyla 1.3

Grafana Beyla, an open source eBPF auto-instrumentation tool, has been able to produce OpenTelemetry trace spans since we introduced the project. However, the traces produced by the initial versions of Grafana Beyla were single span OpenTelemetry traces, which means the trace context information was limited to a single service view. Beyla was able to ingest TraceID information passed to the instrumented service, but was unable to propagate it upstream to other services.

Grafana Cloud updates: cool visualizations, log monitoring made easier, simplified alert routing

We are consistently releasing helpful updates and fun features in Grafana Cloud, our fully managed observability platform powered by the open source Grafana LGTM Stack (Loki for logs, Grafana for visualization, Tempo for traces, and Mimir for metrics). In case you missed it, here’s a roundup of the latest and greatest upgrades for Grafana Cloud this month. If you’re not a Grafana Cloud user, what are we waiting for?

How to Configure a State Timeline Panel | Grafana

💡 Do you want to know how and when to use state timeline visualizations? Join Senior Developer Advocate Marie Cruz in this beginner-friendly tutorial to learn how to configure a state timeline panel in Grafana. ☁️ Grafana Cloud is the easiest way to get started with Grafana dashboards, metrics, logs, and traces. Our forever-free tier includes access to 10k metrics, 50GB logs, 50GB traces and more. We also have plans for every use case.

Annotating Events with Grafana | Grafana for Beginners Ep. 10

As we observe our system, we are bound to come across some interesting events or failures. By flagging these events and adding context, we can communicate whether further investigation is needed or if action should be taken to address these events. This is known as annotating events. Join Senior Developer Advocate, Lisa Jung to learn how to annotate events with Grafana. ☁️ Grafana Cloud is the easiest way to get started with Grafana dashboards, metrics, logs, and traces. Our forever-free tier includes access to 10k metrics, 50GB logs, 50GB traces and more. We also have plans for every use case.

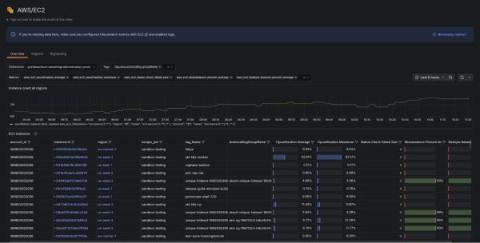
AWS Observability in Grafana Cloud: A simpler, more intuitive cloud monitoring app

We know monitoring your AWS environment can be difficult, which is why we’re thrilled to tell you about a new application we’ve built to make the entire process easier, more efficient, and more intuitive. We’ve offered AWS monitoring capabilities for some time, but with the AWS Observability application in Grafana Cloud, we’ve distilled our collective efforts into a more integrated and potent solution.