As Grafana continues to evolve, we remain dedicated to improving the experience for Grafana users, as well as the developers building applications on top of the platform. Today, we are delighted to introduce the next step in that evolution, the all-new Grafana developer portal — a central hub of curated resources for developers who want to extend Grafana’s capabilities.
This is part three in a series where I learn OpenTelemetry (OTEL) from scratch. If you haven't yet seen them yet, part 1 is about setting up auto-instrumented tracing for Node.js and part 2 is where I initially implemented the OTEL collector. Today we are going to begin experimenting with sampling. We need to sample traces because we capture so much data! It would be impractical to process and store it all (in most cases).
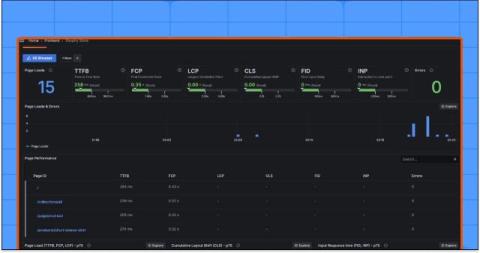
Performance tests created with the Grafana k6 browser module use lab data collected from pre-defined environments, devices, and network settings. Lab data allows you to repeatedly reproduce performance results, making it useful for detecting and fixing performance issues early. Lab data, however, doesn’t account for one very important testing component: real user experience.
Grafana 10.2 is here! Download Grafana 10.2 As always, the latest version of Grafana includes a ton of dashboard and data visualization improvements. You can add interactive buttons to your Canvas visualizations; auto-generate dashboard panel titles, and descriptions using AI; and zoom in on specific y-axis values in your time series.
Last winter, Flexcity — a market leader in electric flexibility — faced an unprecedented challenge: Help stabilize the French national power grid, in the midst of a widespread energy crisis that loomed over Europe. As a byproduct of the Russian invasion of Ukraine, energy prices in the EU soared in 2022. And France, meanwhile, faced a nuclear power outage that winter that threatened to significantly disrupt its energy supply and increase the risk of electricity shortages.