Operations | Monitoring | ITSM | DevOps | Cloud
Dashboards
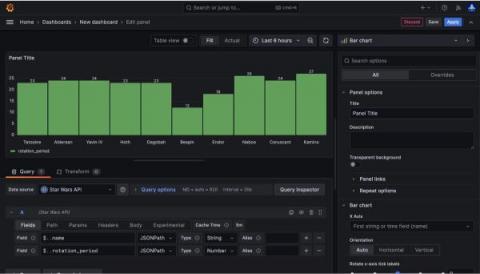
Grafana JSON API: How to import third-party data sources in Grafana Cloud
Have you ever wanted to test out Grafana Cloud but don’t have any available data to monitor? Well, have no fear! With the Grafana JSON API plugin, you can query publicly available JSON endpoints. The JSON API is a wonderful way to start using Grafana Cloud. You can quickly see data in action, and there are a multitude of things you can build, analyze, and monitor using the JSON API.
Grafana Pyroscope 1.0 release: continuous profiling for a modern open source observability stack
When we launched Pyroscope in 2021, we had one clear goal: Give developers a powerful open source continuous profiling tool for collecting, storing, and analyzing profiling data. Grafana Labs had a similar goal when they released Grafana Phlare, a horizontally scalable, highly available open source profiling solution inspired by databases like Grafana Loki, Grafana Mimir, and Grafana Tempo.
Centralize AWS observability with Grafana Cloud
If you’re using AWS, you’re almost certainly using Amazon CloudWatch to collect and analyze observability data from your favorite AWS services. And while AWS remains the most broadly adopted cloud platform, not every company uses it exclusively, which means you need a tool that gives a centralized view across all your environments. With Grafana Cloud, you can do just that.
Generative AI at Grafana Labs: what's new, what's next, and our vision for the open source community
As you’d imagine, generative AI has been a huge topic here at Grafana Labs. We’re excited about its potential role in bridging the gap between people and the beyond-human scale of observability data we work with every day. We’ve also been talking a lot about where open source fits in — especially if that Google researcher is right and OSS will outcompete OpenAI and friends. What role can we play to bring the community along?
Getting started with Grafana Loki (Grafana Office Hours #09)
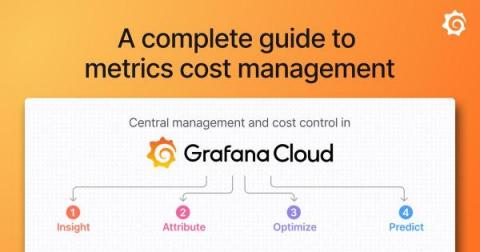
A complete guide to metrics cost management in Grafana Cloud
The macro economy can put a lot of pressure on organizations to reduce costs, typically with the central SRE and platform engineering teams coming under scrutiny. One common workaround we’ve seen countless teams make is compromising their observability by ingesting fewer metrics in the name of cost savings. But for centralized SRE/observability teams, the response to macro conditions should not be monitor less, but rather monitor smarter.
Grafana vs. Kibana
Every organization requires data analysis and monitoring solutions to gain insights into their data. Grafana and Kibana are two of the most popular open-source dashboards for data analysis, visualization, and alerting.
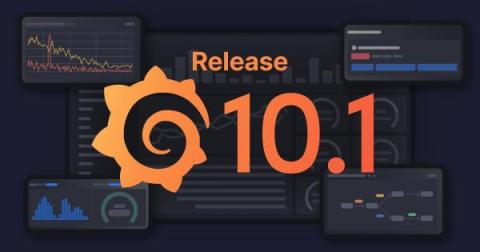
Grafana 10.1 release: Enhanced flame graphs, new geomap network layer, and more
Grafana 10.1 is here! The latest Grafana release introduces new features and improvements that help deepen your observability insights in Grafana, including an improved flame graph, a new geomap network layer, simplified alerting workflows, and more. Grafana 10.1: Download now! For an overview of all the features in this release, check out our What’s New documentation. And to learn the details about all the Grafana 10.1 updates, read our changelog for more information.


