Operations | Monitoring | ITSM | DevOps | Cloud

Dashboards

Grafana Loki 2.9 release: TSDB volume endpoints, remote rule evaluations, LogQL optimizations

The Loki squad is excited to announce Grafana Loki 2.9 is here! For this release, we’ve developed additional TSDB endpoints to help you better understand your log volume; introduced query language optimizations to make parsing more performant; and restructured our documentation so it is easier to use. This coincides with the release of Grafana Enterprise Logs (GEL) 1.8, so all the features discussed here are available in both Loki 2.9 and GEL 1.8.

Simplify observability with the Grafana OpenTelemetry Starter and Spring Boot 3

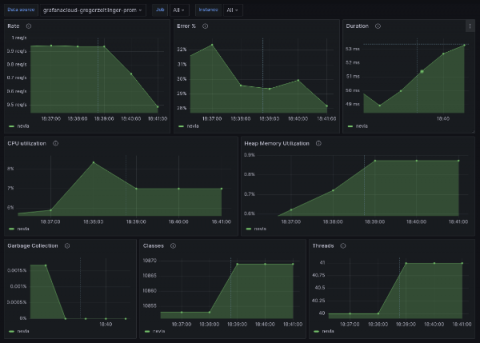
To help simplify instrumenting Spring Boot applications with Grafana Cloud, we are excited to introduce the Grafana OpenTelemetry Starter, a project that connects the latest Micrometer enhancements from Spring Boot 3 with Grafana Cloud using OpenTelemetry. By using these tools, you will have logs, metrics, and traces in a single service — in the same easy way that you can use Prometheus with Spring Boot.

Cloud Cost Dashboards: What "A Single Pane Of Glass" Really Means

If you’ve done any shopping around for a cloud cost intelligence platform, you may have heard about the “single pane of glass” approach to presenting cloud cost data. It’s a descriptive phrase uttered by almost every cloud cost company in one form or another. We may not all say it in a similar way, but it’s the same concept across the board.

What makes a good open source community?

Whenever you use open source software, you benefit from the community that surrounds it — whether it’s a bug fix, better documentation, a helpful tutorial or something else. We at Grafana Labs benefit from the open source community, too: from your participation, and the many OSS components we use in the development of Grafana itself. But what makes an open source community successful, exactly? And how do you build and nurture one?

Grafana Incident auto-summary: AI in Grafana Cloud

Check out a fun demo of Grafana Incident auto-summary, which uses generative AI to suggest a helpful synopsis that captures key details from your incident timeline with a single click. Grafana Incident auto-summary marks the first feature enabled by the new OpenAI integration in Grafana Incident. Simply bring your own OpenAI API key to get started in Grafana Cloud.

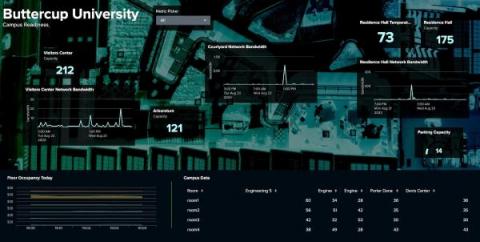
Dashboard Studio: How to Configure Show/Hide and Token Eval in Dashboard Studio

You may be familiar with manipulating tokens via `eval` or `condition`, or showing and hiding panels via `depends` in Classic (SimpleXML) dashboards, and wondering how to do that in Dashboard Studio. In this blog post, we'll break down how to accomplish these use cases in Dashboard Studio, using the same examples that were shown at.conf23.

k6 extensions updates with Ivan Szkiba (k6 Office Hours #99)

In this episode of k6 Office Hours, Developer Advocates Marie Cruz and Paul Balogh are joined by Ivan Szkiba, the latest Grafanista of the k6 team, to discuss the latest developments on the k6 extensions. Links shared: List of templates and extensions discussed: ⏰ TIMESTAMPS.