Operations | Monitoring | ITSM | DevOps | Cloud
How The Washington Post uses Datadog to detect and respond to traffic spikes early
Monitor your IoT devices at scale with Datadog Log Management
The Internet of Things (IoT) can be found in a diverse range of devices, including fleets of autonomous vehicles, automobiles, planes, electric charging stations, and voice controllers. These devices are embedded with gateways, electronics, actuators, platform hubs, and cloud-service connectivity, enabling them to exchange data across the physical, network, and application layers that constitute IoT architecture.
Monitor SQL Server and Azure managed databases with Datadog DBM
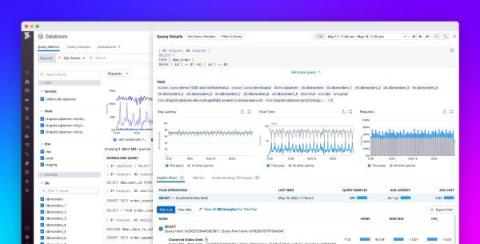
Datadog Database Monitoring (DBM) provides comprehensive visibility into SQL queries running on your databases. Using DBM, you can troubleshoot database performance issues by drilling into frequently used queries and analyzing historical trends in your queries’ metrics and execution plans. Whether you operate self-hosted SQL Server instances or leverage Azure’s fully managed services, DBM can provide deep visibility into the databases your application depends on.
Get immediate visibility into Azure Kubernetes Service with Datadog's powerful AKS dashboard
We’re pleased to announce a new out-of-the-box dashboard for Azure Kubernetes Service (AKS) that allows you to immediately visualize the health and performance of your AKS clusters. This dashboard organizes and highlights the most critical information from the standard AKS metrics, while also incorporating log data to provide observability into the control plane.
Take control of your telemetry data with Datadog Observability Pipelines
Many organizations manage applications that are supported by a large number of services in multiple environments, ranging from the cloud to their own data centers across the globe. As these organizations scale and accelerate service adoption, the volume of telemetry data in their environments multiplies every year.
Monitor and diagnose network performance issues with SNMP Traps
Monitoring your on-premise or hybrid infrastructure means keeping track of potentially thousands of devices, any one of which could be a point of failure. Additionally, silos between application and network teams can create visibility gaps that complicate troubleshooting. For network engineers investigating bottlenecks, being able to view real-time infrastructure health and performance data alongside application metrics is essential for ensuring their organizations meet key SLOs.
Datadog named Leader in 2022 Gartner Magic Quadrant for APM and Observability
Gartner® has published the 2022 Magic Quadrant™ for APM and Observability, an annual report that evaluates vendors in this category. We’re honored that Datadog has been recognized as a “Leader” within this Magic Quadrant report for the second consecutive year, with the highest position for Ability to Execute.
Monitor Datazoom telemetry with Datadog
Modern video streaming workflows are composed of many different services, including encoders, origins, ad servers, content delivery networks (CDNs), and more. This wide range of options enables organizations to choose the tools that best fit their needs, but it also introduces considerable observability challenges. For instance, you may have limited access to the log data from each layer of your video workflow, and the data you can access likely isn’t standardized.
The State of Serverless
Updated June 2022. This research builds on the previous edition of this article, which was published in May 2021. Click here to download the graphs for each fact.


