Operations | Monitoring | ITSM | DevOps | Cloud

Datadog

How to categorize logs for more effective monitoring

Logs provide a wealth of information that is invaluable for use cases like root cause analysis and audits. However, you typically don’t need to view the granular details of every log, particularly in dynamic environments that generate large volumes of them. Instead, it’s generally more useful to perform analytics on your logs in aggregate.

Test file uploads and downloads with Datadog Browser Tests

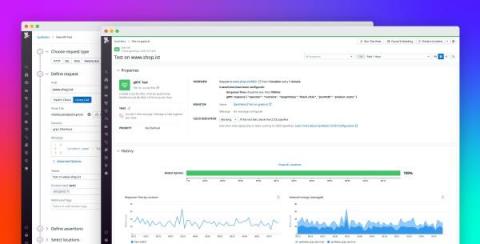
Understanding how your users experience your application is critical—downtime, broken features, and slow page loads can lead to customer churn and lost revenue. Last year, we introduced Datadog Browser Tests, which enable you to simulate key user journeys and validate that users are able to complete business-critical transactions.

Monitor RethinkDB with Datadog

RethinkDB is a document-oriented database that enables clients to listen for updates in real time using streams called changefeeds. RethinkDB was built for easy sharding and replication, and its query language integrates with popular programming languages, with no need for clients to parse commands from strings. The open source project began in 2012, and joined the Linux Foundation in 2017.

Monitor Carbon Black Defense logs with Datadog

Creating security policies for the devices connected to your network is critical to ensuring that company data is safe. This is especially true as companies adopt a bring-your-own-device model and allow more personal phones, tablets, and laptops to connect to internal services. These devices, or endpoints, introduce unique vulnerabilities that can expose sensitive data if they are not monitored.

Introducing our AWS 1-click integration

Datadog’s AWS integration brings you deep visibility into key AWS services like EC2 and Lambda. We’re excited to announce that we’ve simplified the process for installing the AWS integration. If you’re not already monitoring AWS with Datadog, or if you need to monitor additional AWS accounts, our 1-click integration lets you get started in minutes.

Using Log Patterns to Create Log Exclusion Filters | Datadog Tips & Tricks

In part 2 of this 2 part series, you’ll learn how to use Log Patterns to quickly create log exclusion filters and reduce the number of low-value logs you are indexing. Datadog’s Logging with Limits™ feature allows you to selectively determine which logs to index after ingesting all of your logs. Meanwhile, the Log Patterns feature can quickly isolate groups of low-value logs.

How to Generate Metrics from Logs | Datadog Tips & Tricks

In this video, you’ll learn how to generate metrics using log events attributes to filter your logs more effectively and begin monitoring, graphing and alerting on the new metric immediately. Generating metrics from logs is a powerful tool for monitoring attributes which are parsed from your logs.

Datadog on Kubernetes

When 2 years ago Datadog decided to move its infrastructure platform to Kubernetes we didn’t expect to find so many roadblocks, but ingesting trillions of datapoints per day in a reliable fashion requires pushing the limits of cloud computing. Creating and managing dozens of clusters, with thousands of nodes each and operating in several clouds was a challenging but rewarding learning experience. In this episode Ara Pulido, Developer Advocate, will chat with Laurent Bernaille, Staff Engineer at Datadog and part of the team that created Datadog’s Kubernetes platform. We’ll cover the challenges we found creating and scaling Datadog’s Kubernetes platform and how we overcame them.

Datadog on Kafka

As a company, Datadog ingests trillions of data points per day. Kafka is the messaging persistence layer underlying many of our high-traffic services. Consequently, our Kafka usage is quite high: double-digit gigabytes per second bandwidth and the need for petabytes of high performance storage, even for relatively short retention windows. In this episode, we’ll speak with two engineers responsible for scaling the Kafka infrastructure within Datadog, Balthazar Rouberol and Jamie Alquiza. They'll share their strategy in scaling Kafka, how it’s been deployed on Kubernetes, and introduce kafka-kit; our open source toolkit for scaling Kafka clusters. You'll leave with lessons learned while scaling persistent storage on modern orchestrated infrastructure, and actionable insights you can apply at your organization

Best practices for monitoring GCP audit logs

Google Cloud Platform (GCP) is a suite of cloud computing services for deploying, managing, and monitoring applications. A critical part of deploying reliable applications is securing your infrastructure. Google Cloud Audit Logs record the who, where, and when for activity within your environment, providing a breadcrumb trail that administrators can use to monitor access and detect potential threats across your resources (e.g., storage buckets, databases, service accounts, virtual machines).