Operations | Monitoring | ITSM | DevOps | Cloud
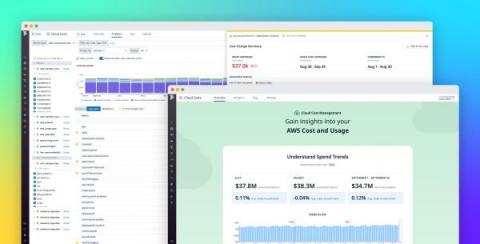
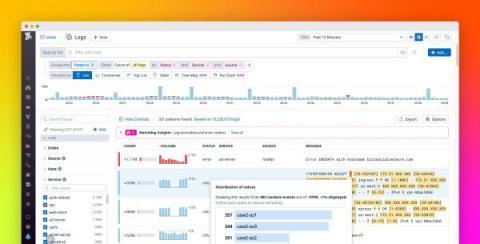
Gain visibility and control of your cloud spend with Datadog Cloud Cost Management
To optimize its cloud investments, your organization needs internal stakeholders to act on shared knowledge about its cloud costs and cloud usage. But in practice, it’s difficult for organizations to gain a high degree of clarity about their cloud spending. The factors contributing to cost data are not normally visible to all stakeholders, and it’s often impossible to attribute costs to the teams, services, and applications that incurred them.
Dash 2022: Guide to Datadog's newest announcements
Today at Dash 2022, we announced new products and features that enable your teams to break down information silos, shift testing to the left, monitor cloud and application security, and more. Now, you can analyze cloud cost data alongside other telemetry, create synthetic tests for your mobile applications, and prevent malicious activity in your environment by blocking IPs directly from Datadog. We expanded Sensitive Data Scanner to include APM, RUM, and Events stream data.
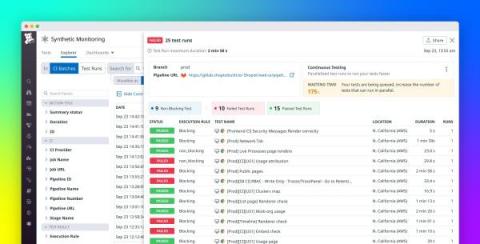
Use Datadog Continuous Testing to release with confidence
Testing early and often in the development cycle is a must for ensuring that your application meets user expectations. Poor performance and errors can alienate users and prevent you from meeting crucial benchmarks and OKRs. Additionally, having to constantly implement fixes after new, under-tested features are added can fatigue developers and strain your resources, making your organization less nimble overall.
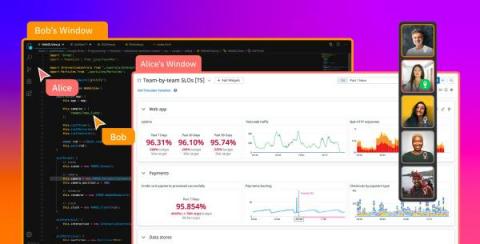
Leverage collaborative screen sharing with Datadog CoScreen
Remote collaboration tools have transformed how remote and hybrid teams work synchronously. But while the current popular chat forum and video conferencing solutions are inarguably helpful, few were created with software development and operations in mind. CoScreen is the only real-time collaboration tool designed specifically for remote and hybrid engineering teams that integrate both interactive screen sharing and video conferencing features.
Identify and redact sensitive data in APM, RUM, and Events stream with Sensitive Data Scanner
Customer-facing applications request and process many types of sensitive data, such as API keys, credit card numbers, and email addresses. As your application scales in size and complexity, it becomes harder to keep track of this sensitive data moving across more services, increasing the risk of data leaks.
Announcing PCI-Compliant Log Management and APM from Datadog
For any organization that stores, processes, or transmits cardholder data, monitoring can pose a particular set of challenges. The Payment Card Industry (PCI) Data Security Standard (DSS) dictates rigorous monitoring and data security requirements for the cardholder data environments (CDEs) of all merchants, service providers, and financial institutions.
Dash 2022 Keynote
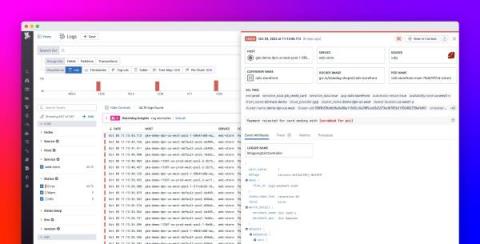
Collect GitHub audit logs and scanning alerts with Datadog
For most organizations, GitHub is mission critical. Your GitHub repositories likely also contain some of your organization’s most sensitive data. GitHub provides tools to help you protect and govern this data, with tools such as audit logs, code scanning alerts, and secret scanning alerts. However, analyzing these logs and alerts through GitHub’s UI can be challenging. For example, looking for trends in your code scanning alerts over time through GitHub’s UI is just not possible.
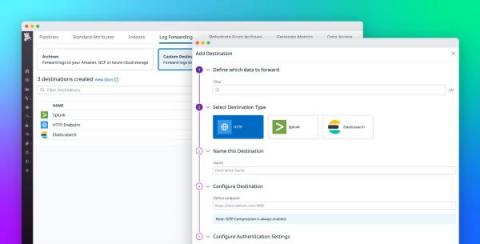
Route logs to third-party systems with Datadog Log Forwarding
Large organizations often rely on multiple monitoring tools, security platforms, and auditing systems to meet the diverse needs of their observability, security, engineering, and compliance teams. Because these teams may use the same logs for many different use cases—including detecting potential threats or breaches, troubleshooting errors, and gauging the effectiveness of new features—it can be difficult to effectively standardize and route data.


