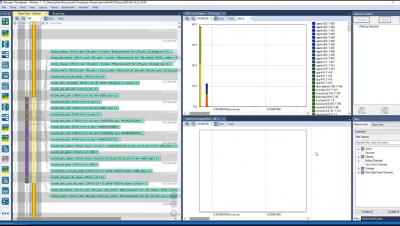
Getting started with Tracealyzer for Linux
A brief introduction on how to get started with the Linux tracing support in Tracealyzer v4.4 Beta.


When I listen to our telecommunications customers describe their biggest frustrations, a consistent theme is the need to seamlessly connect across silos, systems, and processes. Work should be intuitive.
Recently InfluxAce Jorge de la Cruz presented on “Modern vSphere Monitoring and Dashboards Using InfluxDB, Telegraf and Grafana”. Jorge is a Systems Engineer at Veeam Software and has been using InfluxDB for years. In case you missed attending the live session, we have shared the recording and the slides for everyone to review and watch at your leisure.
What if you could get your hands on a force multiplier that got rid of the repetitive, routine work that was tying down your team, got more productivity out of your assembled work force, and gave everyone a more challenging, meaningful to-do list that made better use of their knowledge, experience, and passion?
At Grafana Labs, we’re all big fans of the Prometheus and Grafana combination. To an extent, we just won’t shut up about it. We strongly believe in simplicity and think you shouldn’t need any extra effort to understand the metrics of your service(s) holistically. Yet we’ve all been in that situation where it is challenging to fully grasp what the metrics of our service(s) are and what they do. While naming conventions exist, at times they are not followed or enforced.
In part one of this series, I introduced you to Kubeflow, a machine learning platform for teams that need to build machine learning pipelines. In this section, we will learn how to take an existing machine learning project and turn it into a Kubeflow machine learning pipeline, which in turn can be deployed onto Kubernetes. As you are going through this exercise, think about how you can convert your existing machine learning projects into a Kubeflow one.