Operations | Monitoring | ITSM | DevOps | Cloud

Application Observability, The Next Step in Application Performance Monitoring

Today’s cloud environments rely on microservices, service meshes, containers, and orchestration tools and are too complex for traditional tools to measure and monitor performance metrics effectively. The number of interdependent services—and the inherently ephemeral nature of cloud workloads—make it challenging to identify which metrics to monitor and issues to troubleshoot down to the root cause.

Why Do You Need Smarter Alerts?

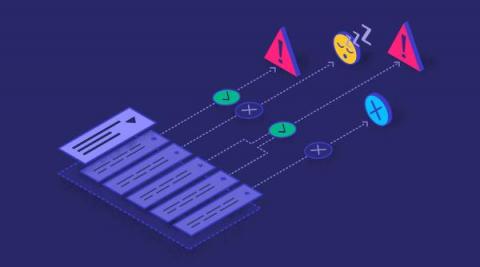
The way organizations process logs have changed over the past decade. From random files, scattered amongst a handful of virtual machines, to JSON documents effortlessly streamed into platforms. Metrics, too, have seen great strides, as providers expose detailed measurements of every aspect of their system. Traces, too, have become increasingly sophisticated and can now highlight even the most precise details about interactions between our services. But alerts have remained stationary.

Three Hidden RMM Features, Part 2: Monitoring Templates

In the first portion of the underutilized RMM features series, we discussed the use of Site Concentrators and Data Overdue Cross-Checks. This time we’re going to discuss Monitoring Templates. MSPs have shied away from Monitoring Templates in the past because of the effort needed to set them up. I think this is the wrong way to look at them; we need to be thinking long-term here.

5 FinTech Log Analytics Challenges Equifax Solved with ChaosSearch

Global data, analytics and technology companies such as Equifax, and their Engineering teams, depend on log analytics for a variety of operational analytics use cases, from application troubleshooting to streamlining cloud operations and regulatory compliance management. ChaosSearch is uniquely positioned to help companies like Equifax significantly reduce the time, cost, and complexity of log analytics.

Introducing Dynamic Sampling

In the monitoring industry there’s a complicated and frustrating conversation that persisted over the years: how do you deal with the enormous volume of data generated by instrumentation? On one side of the aisle, you will find a cohort of vendors and developers telling you that you have to sample data, followed immediately by another group telling you that sampling will ruin the accuracy of incident analysis. They’re both right.

Top 5 Debugging Tips for Kubernetes DaemonSet

Kubernetes is the most popular container orchestration tool for cloud-based web development. According to Statista, more than 50% of organizations used Kubernetes in 2021. This may not surprise you, as the orchestration tool provides some fantastic features to attract developers. DaemonSet is one of the highlighted features of Kubernetes, and it helps developers to improve cluster performance and reliability.

Behind the Scenes with the Kubernetes 1.25 Release

Join us live on August 23 as SUSE's Robert Sirchia hosts Rey Lejano, Emeritus Adviser of the Kubernetes 1.25 release team, during the Kubernetes 1.25 release. Rey will guide you through the Kubernetes Release Process and Release Cycle showcase the highlights of this release. This is your chance to ask questions directly to the people involved and look behind the scenes of the release process.