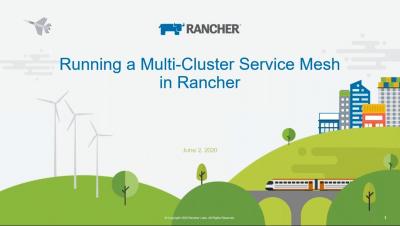
If you are or your organization is running Kubernetes, then it's likely that you are running more than one cluster. This model works well for most, but starts to break down when microservices and service mesh enter the discussion. However, with some additional configuration and tooling , a multicluster mesh can take advantage of distributed Kubernetes environments and the services therein. In this Master Class, recorded on June 20, 2020, Rancher Field Engineer Jason Skrzypek discusses and demos a multi-cluster service mesh running Istio.