Operations | Monitoring | ITSM | DevOps | Cloud

Welcome to the Experience-Driven NOC: Network Path Performance Metrics

On your journey to the Experience-Driven NOC, we make it easy to view and modify the network path metrics collected by AppNeta inside the DX NetOps portal for your Experience-Driven NOC. Metrics like percentiles and projections provide even more observability like capacity planning besides many other insights and can be used in dashboards and reports.

Centralizing Log Data to Solve Tool Proliferation Chaos

As companies evolve and grow, so do the number of applications, databases, devices, cloud locations, and users. Often, this comes from teams adding tools instead of replacing them. As security teams solve individual problems, this tool adoption leads to disorganization, digital chaos, data silos, and information overload. Even worse, it means organizations have no way to correlate data confidently. By centralizing log data, you can overcome the data silos that tool proliferation creates.

Welcome to the Experience-Driven NOC: Network Path Change Alarms and Drill Down Context Pages

On your journey to the Experience-Driven NOC, DX NetOps 22,2 is enabling network operations centers to utilize their standard operating procedures and workflows to triage the performance of the entire network path of any user experience - over managed or unmanaged networks. As with any workflow, we start with an alarm and enable operations to drill down, in-context to the offending network device; giving operators enhanced visibility into network path performance along with key KPIs for focused troubleshooting on any and all user experience impact. For more info, visit broadcom.com/netops

Welcome to the Experience-Driven NOC: Configure DX NetOps to Collect AppNeta Experience Metrics

On your journey to the Experience-Driven NOC, in this video we show you how to configure the DX NetOps gateway to connect to your AppNeta instance with all the relevant information needed to consume experience metrics into the NetOps portal. For more info, visit broadcom.com/netops

Automating testing for FeathersJS applications

This is one of a two-part series. You can also learn how to automate the deployment of FeathersJS apps to Heroku. In the software development lifecycle, testing offers benefits that reach far beyond the code itself. Testing assures all parties (developers, clients, project managers, etc) that, while the application may not be completely bug-free, it does what is expected, as expected.

Advanced Debugging and Monitoring for Serverless Backends

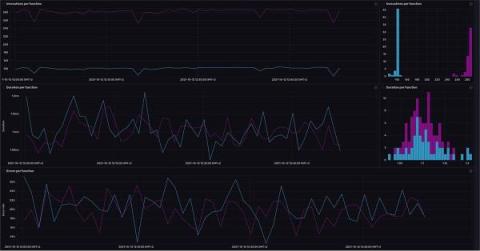
Serverless backends have different monitoring challenges when compared with traditional applications, mostly due to the distributed and proprietary nature of serverless. Making monitoring and debugging efficient for serverless requires a unique set of tools and techniques. In this article, we’ll discuss the challenges of debugging serverless backends and how to utilize third party tools to improve the monitoring process.

What's Missing From Almost Every Alerting Solution in 2022?

Alerting has been a fundamental part of operations strategy for the past decade. An entire industry is built around delivering valuable, actionable alerts to engineers and customers as quickly as possible. We will explore what’s missing from your alerts and how Coralogix Flow Alerts solve a fundamental problem in the observability industry.