Building a successful monitoring process for your application is essential for high availability. In the first of this three-part blog series, Safeer discusses the four key SRE Golden Signals for metrics-driven measurement, and the role it plays in the overall context of Monitoring. Monitoring is the cornerstone of operating any software system or application effectively. The more visibility you have into the software and hardware systems, the better you are at serving your customers. It tells you whether you are on the right track and, if not, by how much you are missing the mark.
Large-scale software projects don't care how many unit tests you put into your code. Or how sophisticated your CI/CD pipeline is. Or how robustly you run blue-green deployments to ease into newly-deployed code. These projects will inevitably find themselves subjected to your users, who will uncover bugs your team didn't catch and didn't even think to test for.
Ninja Ticketing has been out for just over 6 months and is now generally available to all customers. Our 5.3.1 release adds a ton of improvements based on both our strategic roadmap for ticketing and early adopter feedback.
Ninja's feature-packed 5.3.1 release provides a ton of out-of-box functionality, better reporting, and improved user permissions. 5.3.1 also includes major updates to Ninja Ticketing that you can read about here.
As of today, Bleemeo is not ingesting logs file, but you can use some external tool to ingest logs metrics which should be pretty useful as it will help you to identify issues and trigger an alarm. You will still have to connect to the machine to check logs, but trends and alarms are centralized in your favorite monitoring tool.
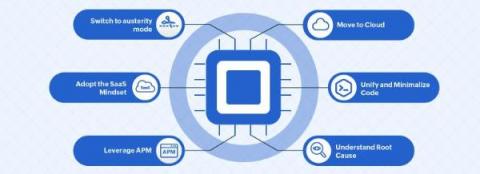
Since mid-2020, several global factors including a drought in Taiwan and the COVID-19 pandemic have resulted in a semiconductor chip shortage, which worsened further as demand for electronics shot up during the pandemic. As offices and schools moved to homes and digital services became essential, in 2020 alone, 297 million PCs were sold, up 11% over the previous year.
Purchase order management is not done easily, it becomes more complicated when they are done manually. Manual purchase request processes lead to more complications and error chances are more & accuracy compromises. They consume lots of administrative challenging work, time, cash. Projects get deferred and disarray increments, and nobody truly realizes what is happening.
Metrics and runtime characteristics for application server monitoring are critical for the applications running on each server. Monitoring also helps to prevent or manage possible problems promptly. Apache Tomcat is one of the most widely used servers for Java applications. JMX beans or a monitoring tool like MoSKito or JavaMelody can be used in Tomcat performance monitoring.