Operations | Monitoring | ITSM | DevOps | Cloud
The latest News and Information on Distributed Tracing and related technologies.
Simplify OpenTelemetry Pipelines with Headers Setter
In telemetry jargon, a pipeline is a directed acyclic graph (DAG) of nodes that carry emitted signals from an application to a backend. In an OpenTelemetry Collector, a pipeline is a set of receivers that collect signals, runs them through processors, and then emits them through configured exporters. This blog post hopes to simplify both types of pipelines by using an OpenTelemetry extension called the Headers Setter.
What Is OpenTelemetry? A Complete Introduction
APM vs Tracing vs Observability
Application Performance Monitoring (APM), tracing, and observability are fundamental software development and system management approaches. Each of these three concepts uniquely ensures that your applications operate, efficiently, smoothly, and reliably. Your organisation will more than likely already adopt one of these approaches, or even two, potentially all three.
How to configure OpenTelemetry .NET Automatic Instrumentation with Grafana Cloud
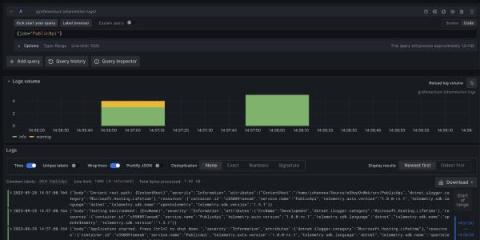
For those who have limited experience with OpenTelemetry, it can be intimidating to instrument.NET applications. But the OpenTelemetry community created a welcome shortcut with the first stable release of.NET Automatic Instrumentation. It simplifies the process of collecting metrics, logs, and traces from your.NET applications, without applying any changes to the source code or adding any dependencies to the OSS project.
Top 10 Distributed Tracing Tools For Your Success
In the intricate web of modern software systems and full-stack observability, knowing how requests flow and interact across distributed components is paramount. Distributed tracing tools can help you. To better understand how distributed tracing works and benefits, here’s our selection of top distributed tracing tools to choose from.
How to integrate a Spring Boot app with Grafana using OpenTelemetry standards
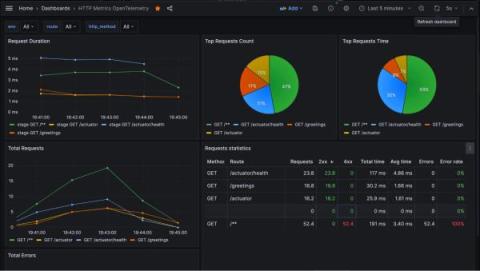
Maciej Nawrocki, Senior Backend Developer at Bright Inventions, is a backend developer focused on DevOps and monitoring. Adam Waniak, Senior Backend Developer at Bright Inventions, is a backend developer with a keen interest in DevOps. Bright Inventions is a software consulting studio based in Gdansk, Poland, with expertise in mobile, web, blockchain, and IOT systems. At Bright Inventions, we always prioritize app optimization when we develop software solutions for our clients.


