Operations | Monitoring | ITSM | DevOps | Cloud

Tracing

The latest News and Information on Distributed Tracing and related technologies.

Sponsored Post

Transaction Tracking vs Transaction Tracing - What's the Difference?

Transaction tracking and tracing are not the same thing. One of the top 10 banks in the world recently chose Nastel and this was their primary reason. They had a Priority 1 request processor incident on the mainframe where high value messages went missing and it took two weeks to find them. They began by looking at another vendor who said that they did transaction tracking. As the customer said, "They will try to tell you that they do transaction tracking, and that took us a while to drill down." So, let me explain the difference between these terms using an analogy.

gRPC - Monitor gRPC calls with OpenTelemetry | Explained with a Go example

OpenTelemetry can only help in generating the telemetry data. In order to store, and analyze that data, you need to choose a backend analysis tool. In this article, we will monitor collected data from gRPC calls with SigNoz. SigNoz is a full-stack open-source APM tool that provides metrics monitoring and distributed tracing. It is built to natively support OpenTelemetry data formats. Hence, it’s a great choice for a backend analysis tool to combine with OpenTelemetry. On a side note, OpenTelemetry provides you the freedom to select a backend analysis tool of your choice.

How to monitor Tomcat with OpenTelemetry

We are constantly working on contributing monitoring support for various sources, the latest in that line is support for Tomcat monitoring using the JMX Receiver in the OpenTelemetry collector. If you are as excited as we are, take a look at the details of this support in OpenTelemetry’s repo. You can utilize this receiver in conjunction with any OTel collector: including the OpenTelemetry Collector and observIQ’s distribution of the collector.

NextJS - Monitoring your NextJS application using OpenTelemetry and SigNoz

In this video, we demonstrate how to implement OpenTelemetry NextJS libraries for a sample NextJS application and then visualize the collected data in SigNoz. More about SigNoz: SigNoz - Monitor your applications and troubleshoot problems in your deployed applications, an open-source alternative to DataDog, New Relic, etc. Backed by Y Combinator. SigNoz helps developers monitor applications and troubleshoot problems in their deployed applications. SigNoz uses distributed tracing to gain visibility into your software stack.

Elixir - Monitor your Elixir Application with OpenTelemetry and SigNoz

SigNoz provides query and visualization capabilities for the end-user and comes with out-of-box charts for application metrics and traces. Now let’s get down to how to implement OpenTelemetry in your Elixir application. More about SigNoz: SigNoz - Monitor your applications and troubleshoot problems in your deployed applications, an open-source alternative to DataDog, New Relic, etc. Backed by Y Combinator.

How to send logs to Grafana Loki with the OpenTelemetry Collector using Fluent Forward and Filelog receivers

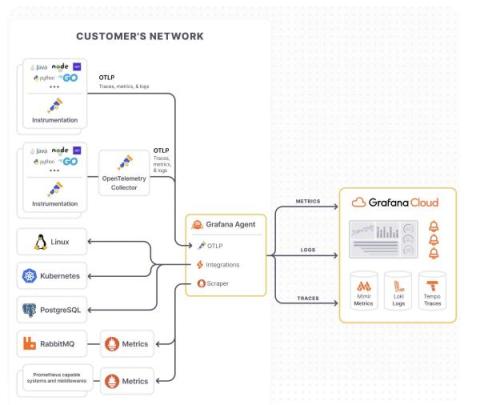
In this guide, we’ll set up an OpenTelemetry Collector that collects logs and sends them to Grafana Loki running in Grafana Cloud. We will consider two examples for sending logs to Loki via OpenTelemetry Collector. The first one shows how to collect container logs with a Fluent Forward receiver. The second one shows how to collect system logs with a Filelog receiver.