Operations | Monitoring | ITSM | DevOps | Cloud

February 2025

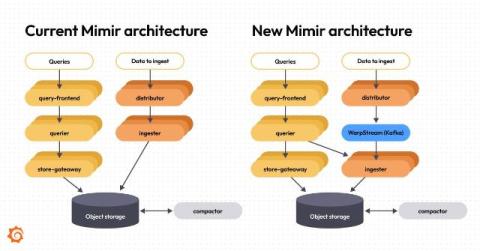
The next generation of Grafana Mimir: Inside Mimir's redesigned architecture for increased reliability

This year Grafana Mimir — the open source, horizontally scalable, multi-tenant time series database (TSDB) — will celebrate its third anniversary. Over the years, Mimir has become the go-to, Prometheus-compatible metrics backend within the open source community, with 29 maintainers and more than 4.6k GitHub stars. Since introducing Mimir, we’ve worked hard to deliver on our promise of making it the most scalable and performant open source TSDB in the world.

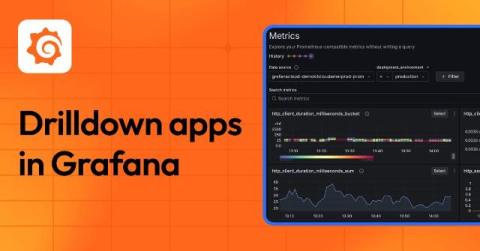
Grafana Drilldown apps: the improved queryless experience formerly known as the Explore apps

When we introduced the Explore apps suite for metrics, logs, traces, and profiles last year at ObservabilityCON 2024, our goal was simple: offer a queryless, point-and-click experience so you can quickly find insights in your observability data—no queries or complicated syntax required. Our commitment to that goal remains unchanged, but we’re excited to announce that the Explore apps have a new name: Grafana Drilldown.

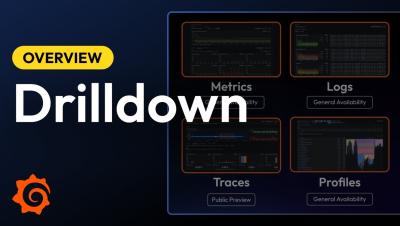
Drilldown apps: An improved queryless experience for faster insights into your observability data

See how we're improving the apps to help you quickly get insights into your logs, metrics, traces, and profiles, and find out why we changed the name from Explore apps to Drilldown. Grafana Cloud is the easiest way to get started with Grafana dashboards, metrics, logs, and traces. Our forever-free tier includes access to 10k metrics, 50GB logs, 50GB traces and more. We also have plans for every use case.

Grafana Cloud updates: Exemptions in Adaptive Logs, GPU monitoring in AI Observability, and more

We consistently roll out helpful updates and fun features in Grafana Cloud, our fully managed observability platform powered by the open source Grafana LGTM Stack (Loki for logs, Grafana for visualization, Tempo for traces, and Mimir for metrics). In case you missed them, here’s our monthly round-up (the first of 2025!) of the latest and greatest Grafana Cloud updates. You can also read about all the features we add to Grafana Cloud in our What’s New in Grafana Cloud documentation.

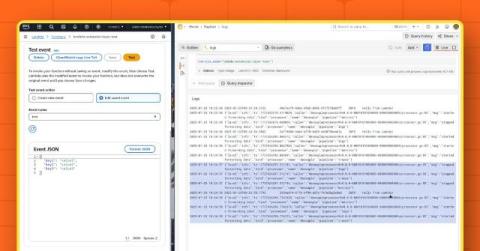
How to observe AWS Lambda functions using the OpenTelemetry Collector and Grafana Cloud

Getting telemetry data out of modern applications is very straightforward—or at least it should be. You set up a collector that either receives data from your application or asks it to provide an up-to-date state of various counters. This happens every minute or so, and if it’s a second late or early, no one really bats an eye. But what if the application isn’t around for long? What if every second waiting for the data to be collected is billed?

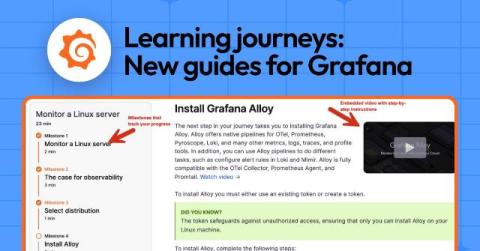
Introducing Learning journeys: New step-by-step guides to get started with Grafana

Our Big Tent philosophy provides the foundation for our broad, modular, and flexible observability platform. With Grafana’s powerful ability to integrate with a wide range of data sources, tools, and plugins, you can create customized solutions tailored to your unique needs.

Grafana Loki 3.4: Standardized storage config, sizing guidance, and Promtail merging into Alloy

The Grafana Loki 3.4 release is here, and it brings a fresh wave of enhancements aimed at standardizing Loki’s object storage, helping you right size your instance, and improving the ability to ingest out-of-order logs. Loki 3.4 also represents the official merging of Promtail into Grafana Alloy as part of our efforts to give our users a single telemetry collector. There’s a lot to go over, so let’s dive in.

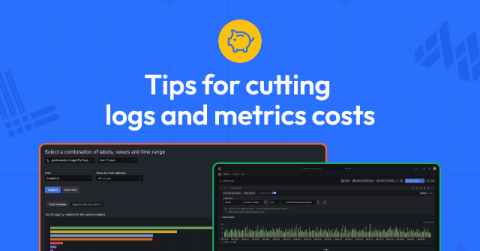
How to cut costs for metrics and logs: a guide to lowering expenses in Grafana Cloud

Observability is essential to maintaining system reliability, but as your infrastructure scales, so do your costs. Between metrics and logs, managing telemetry data can become overwhelming and expensive. Grafana Cloud is already designed to be cost-efficient, but scaling can still present cost challenges. The good news? Grafana provides robust tools and best practices to help optimize observability data and rein in spending.

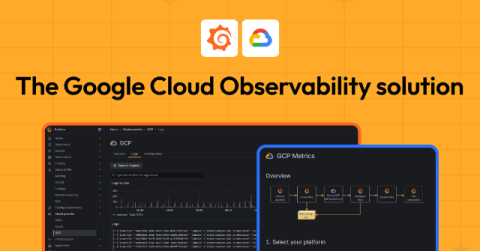
Monitor Google Cloud: simplify and centralize your cloud provider observability with Grafana Cloud

Organizations increasingly rely on Google Cloud to power critical parts of their businesses, but managing those environments often involves navigating a labyrinth of disparate data, tools, and processes. We built Google Cloud Observability in Grafana Cloud to reduce the complexity and confusion by providing a unified, scalable solution designed to simplify monitoring, enhance visibility, and optimize costs.

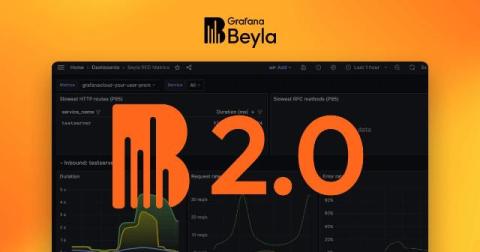
Grafana Beyla 2.0: distributed traces, scalable Kubernetes deployments, and more

In November 2023, we released Grafana Beyla 1.0, the first major milestone in our pursuit of zero-code (and zero-effort) eBPF instrumentation. We delivered a way — through a single command-line — to automatically instrument any application supporting HTTP/gRPC protocols, as well as provide basic network packet flow information.

From Datadog to Grafana Cloud: Why companies migrate and how it changes business for the better

“Impossibly expensive.”“Generic database metrics.”“Exceeding limits.”“No transparency.” These are the words our customers use to explain why they looked for a Datadog alternative and migrated onto Grafana Labs’ observability solutions. Grafana Cloud provided the scalability that LexisNexis Risk Solutions needed to migrate acquired companies into a unified observability platform. “We’ve had migrations from Datadog.

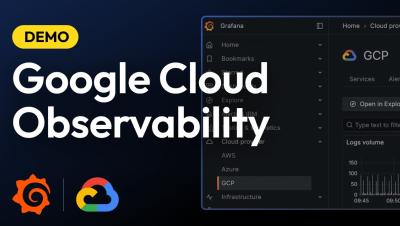
Observe Your Google Cloud Infrastructure | Demo: New Grafana Cloud Application | Grafana Labs

Want to monitor your Google Cloud infrastructure more effectively? Join Vasil Kaftandzhiev as he introduces Grafana Cloud’s new application designed specifically for Google Cloud observability. In this video, you'll discover how to: Optimize and troubleshoot your Google Cloud services Leverage out-of-the-box dashboards with key metrics and thresholds Set up comprehensive alerting for real-time incident response Streamline log management with an all-in-one logs view for faster root cause analysis Configure logs and metrics effortlessly using Grafana Alloy.

Why observability needs FinOps, and vice versa: the Vantage integration with Grafana Cloud

Ben Schaechter is co-founder & CEO of Vantage, a cloud cost management platform that provides actionable insights for every engineer. Observability tools have changed the way we monitor infrastructure and applications, as teams get complete visibility into performance across complex, multi-cloud environments. But as all that infrastructure scales, costs rise with it, and organizations are left to ask: Where are my costs going—and why?

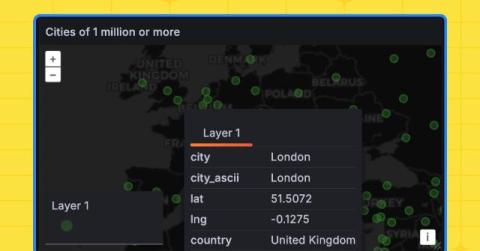
How to visualize CSV data with Grafana

While CSV data is often associated with popular spreadsheet apps like Google Sheets or Microsoft Excel, Grafana offers a number of capabilities to quickly visualize and analyze data stored in a CSV format. In this post, we’ll walk through an example of how to use Grafana to visualize any CSV file from anywhere on the web. More specifically, we will: Moving forward, you can also apply these steps to build any kind of dashboard within Grafana.

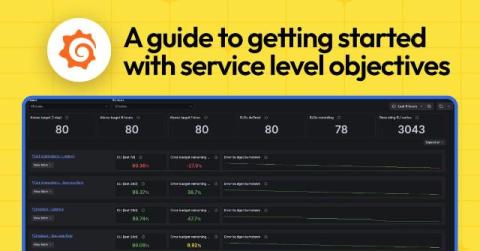
SLOs: a guide to setting and benefiting from service level objectives

If you’re running a technology-driven business, reliability isn’t optional—it’s essential. But how do you balance speed and innovation with a level of reliability that satisfies your customers? That’s where service level objectives (SLOs) come in. SLOs offer a framework for defining and achieving reliability goals, aligning technical efforts with user needs, and driving meaningful outcomes for your business.

How to Set Up Actually Useful SLOs | Introduction to SLOs | Grafana Labs

Service Level Objectives (SLOs) should be more than just numbers on a dashboard—they should help your team deliver real value to your users. In this video, Jake Swiss from Grafana Labs walks you through three simple steps to create SLOs that align with business goals and drive better decision-making. Step 1: Understand What Really Matters – Align SLOs with customer expectations Step 2: Define Clear, Measurable Targets – Use RED metrics (Rate, Errors, Duration) to track meaningful performance Step 3: Continuously Iterate & Fine-Tune – Adjust SLOs based on historical data and team feedback.

How to Overcome Alert Fatigue in Your Alerting System | Introduction to SLOs | Grafana Labs

Cut Through Alert Noise with SLOs! Tired of endless alerts that don’t reflect real issues? SLOs (Service Level Objectives) help reduce noise by focusing on what truly impacts users. Instead of reacting to every minor spike, set SLOs to trigger alerts only when reliability is at risk.