Dashboards

Myth busted: Kibana isn't just for developers - it's for everyone

Kibana is for everyone. As the creators of the Elastic Stack, we get a lot of feedback when chatting with our users from all corners of the world during ElasticON events, in GitHub and forums, and while helping folks resolve their support cases. One of the things we've heard in the past is that Kibana is difficult to use. And we've listened to our community!

Get detail AND insight from your metrics

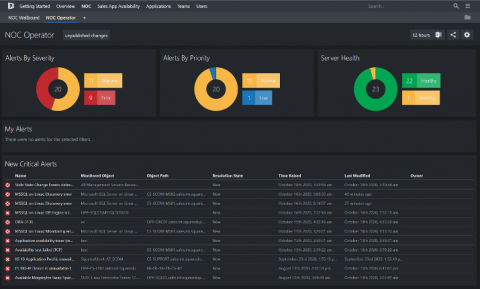
We who use SCOM know about its extensive monitoring capabilities, but the static nature of the SCOM console is not one of its strong points. You can’t drill down to see the data, or correlate data with other data types or alerts for the same object. To the delight of our customers, SquaredUp allows you to do all that and much more – so that you can get all the detail and insight you need, from the metrics you are already collecting.

Grafana Tutorial: Automating Common Grafana Actions

Grafana is probably the most popular visualization software and a Hosted Grafana is provided by MetricFire. Every day, our users have to perform certain actions and most of them are repetitive. For example, you might want to automatically create a bunch of different folders with dashboards in them. This tutorial will show you how to do that with Terraform, which is very popular in the DevOps circles, and how to go even further by using the client library yourself to automate more.

Grafana vs Chronograf: Pricing

Grafana vs InfluxDB – Both offer their cloud services for storing, visualizing and alerting on any kind of time-series data. Both cloud offerings differ from each other in various ways and follow distinct pricing strategies. In this article, we cover the details of Grafana as a service and InfluxDB Cloud, their features and benefits along with their pricing models. MetricFire is a Hosted Grafana service, where you can use Grafana dashboards directly in the MetricFire platform.

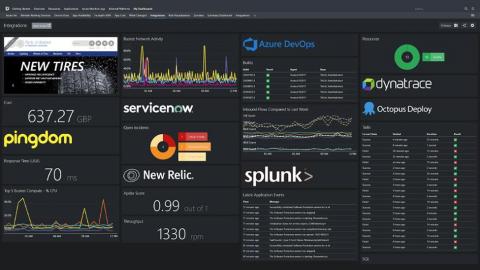
Reduce monitoring silos with SquaredUp WebAPI and SQL tiles

SCOM is a great solution to monitor your infrastructure. Everything you need for in-depth monitoring is provided out-of-box or with a dedicated management pack. If your organization is genuinely invested with SCOM, you probably also know that you can get in-depth monitoring with SCOM’s Application Performance Monitoring (APM) functionality, and collect events across your servers with SCOM’s Audit Collection Services (ACS).

Introducing the MongoDB Enterprise plugin for Grafana

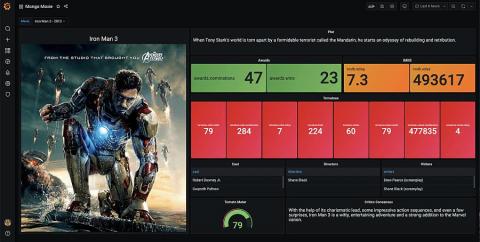
MongoDB is one of the most popular NoSQL databases in the world, used by millions of developers to store application metrics from e-commerce transactions to hospital equipment inventory, from user logins to First World War diaries. MongoDB databases contain mountains of information that SREs, software engineers, and executives can visualize to run their businesses more effectively. Grafana dashboards are most effective when they are layered with context.

Incident response: Is MTTI the metric that matters most?

We all know that SCOM is a monitoring powerhouse, but even the biggest SCOM fan can’t deny that the SCOM Console dashboards leave much to be desired. They might look colorful, but unfortunately there’s not much else they can do. You can’t drill down further into an object, and you definitely can’t correlate it with other data you might have on that object that could be related.

The Top IT Dashboards You Should Be Using

Technology has evolved the critical need for accessing real-time applications such as cloud-collaboration, VoIP and video conferencing from anywhere in the world. CIOs who prioritize around the clock performance and availability for cloud-based productivity tools, have an opportunity to deliver more value and can give their business a competitive edge. IT dashboards are a critical tool in enabling productivity. However, one of the biggest challenges that IT leaders face is to integrate data from multiple business systems that are already in place, both on-premise and in cloud solutions.

Add context to your dashboards from SQL data sources New SQL tile: Line graph

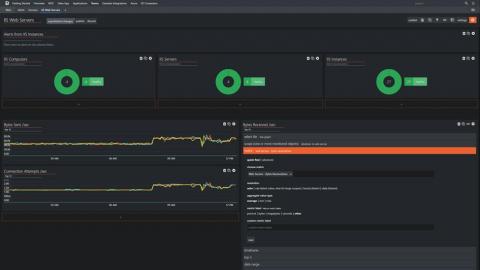
Monitoring information that matters to you will often come from disparate sources – whether you are a server engineer, a SQL database administrator, or an application owner wanting a 360 view of your applications’ health. For example, you may want to visualise your server metrics from SCOM alongside historical trends from the SCOM Data Warehouse.