Dashboards

The new Grafana Cloud: the only composable observability stack for metrics, logs, and traces, now with free and paid plans to suit every use case

Oftentimes users of open source are told to go download it and figure it out… or pay for a managed solution in the cloud. So the typical choice is free and do-it-yourself or expensive and easy. With our new changes to Grafana Cloud, we are making it both free and easy to have a real, composable observability solution.

How to build the ideal dev team dashboard

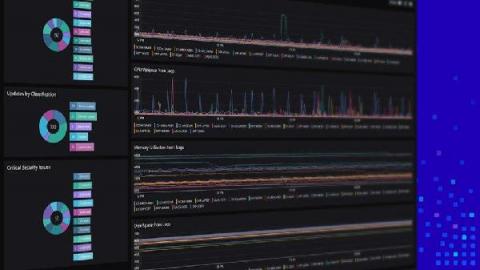
So you’ve now finally finished putting all the pieces together – transitioned to Azure, deployed resources, deployed applications, got familiar with Azure Monitor and set up all the monitoring. You’re now collecting all the monitoring, application performance and security data for your Azure resources in Log Analytics workspaces, ready for analysis. (Head over to our Azure Monitor Learning Path if you're still figuring out how to do all that.) But is only the collection enough?

Looking ahead: SquaredUp 5.0 and beyond

Welcome to 2021, a year we are all entering full of hope. None of us knows quite what 2021 holds in store with regards to the global pandemic, but no doubt it will be another year of huge change. That will mean continued pressure on IT organizations across all industries to adapt and deliver new services to the business and users, all while keeping costs as low as possible. As we start a new year, many of you reading this will be considering your monitoring strategy in 2021 and beyond.

Working with On-prem machines in SquaredUp for Azure

If you’ve been using SquaredUp for Azure, you’re familiar with its abilities to treat Azure native virtual machines . You can create a number of amazing and useful visualizations with them, such as displaying their health state, performance charts, costs, and so on. This is all excellent and super useful, but one question we frequently get asked is: how do I do these things with my on-prem servers that I’ve connected to Azure Monitor?

How using Grafana (and plugins) gave a jolt to Smart State Technology, a company advancing technology for energy infrastructures

Smart State Technology (SST) is a company based in the Netherlands that develops advanced technological and future-proof solutions for smart grids. Their mission is to reinforce critical energy infrastructures by providing innovative energy solutions that connect industry and research, while ensuring society can fully benefit a sustainable energy future.

Service Map & Dashboards (beta) Provide Insight into Health and Dependencies of Microservice Architecture

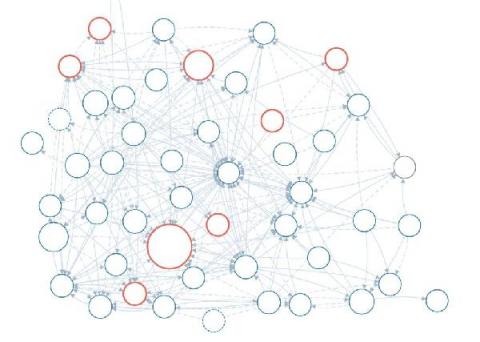
With almost every blog you read about monitoring, troubleshooting, or more recently, the observability of modern application stacks, you’ve probably read a statement saying that complexity is growing as a demand for more elasticity increases which makes management of these applications increasingly difficult. This blog will be no exception, but there’s a good reason for that: we just enabled the first Sumo Logic customers with powerful new tools to tackle these exact challenges.

Introducing Azure Management Talk

Happy New Year everyone! We are thrilled to be starting 2021 with some exciting news. Come February 2nd, we’ll be kicking off Azure Management Talk, a bite-sized webinar series with a focus on all things Azure management. Azure is fast-evolving, and often, it can get quite complicated. With so many things to learn and not enough time, the huge swathes of learning resources available online can quickly get overwhelming.

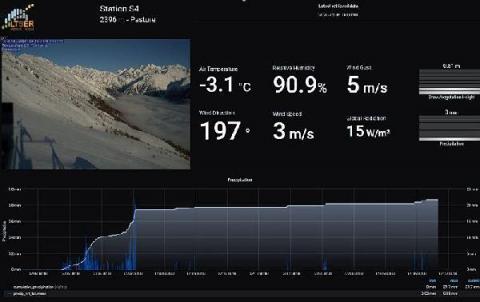
IoT monitoring with Grafana: How Eurac observes climate change in the Alps

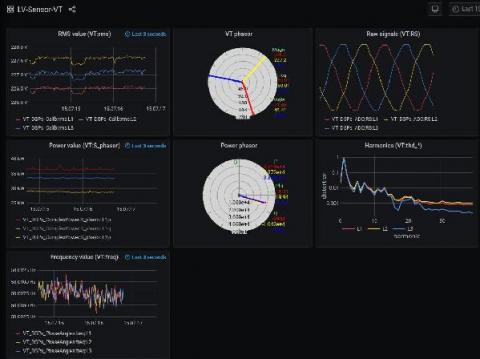
In 2014, the Mazia (Matsch) research site in the Italian Alps was officially accepted as a Long Term Socio Ecological Research LT(S)ER site. The monitoring infrastructure is operated by Eurac Research and the University of Bolzano and consists of 24 automatic microclimatic stations in a mountain ecosystem across an elevation gradient ranging from 1,000 m to 2,700 m, logging several meteorological and biophysical variables every 15 minutes.

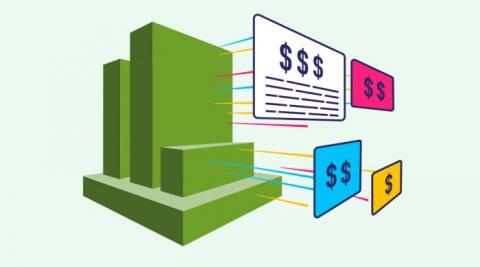
Is CloudWatch Really Cost Efficient?

One of the keys to CloudWatch’s success is its no bang, no buck billing system. The pricing structure has been designed from the outset to ensure that CloudWatch users only pay for what they actually use. In addition, the CloudWatch Free Tier allows first time users to test the waters without shelling out. The downside of this flexibility and adaptability is complexity.

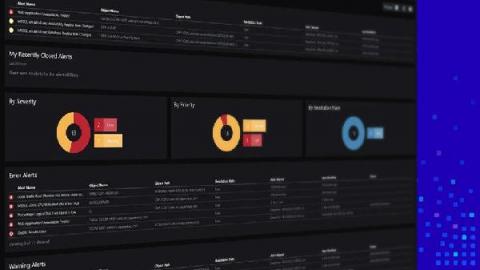
On/Off NOC Dashboards with SquaredUp

How do you define your workday? You walk into your office, grab a coffee, turn on your laptop and take a look at your central source of information – often dashboards – to glance at things happening overall, tasks assigned to you and sketch your schedule accordingly. A lot of our customers we talk to share a routine like this, and SquaredUp dashboards are often their one-stop-shop for consuming alerts/tasks that need their attention.