Dashboards

Introducing the Service Map in Datadog

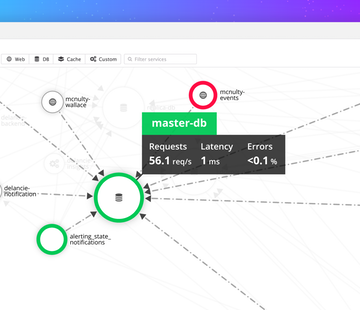
When your pager goes off at 3:00 a.m. and you need to begin your investigation, where do you start? Before you can attack the problem, you need to know the lay of the land: What else is potentially affected by this failing service? What are its dependencies? Where are the probable root causes? With the new Datadog Service Map, you can visualize the topology of your application to answer these questions and more.

How the New Influx Query Engine Was Designed-And How to Use It With Grafana

Flux, the long-awaited new functional query processing engine for InfluxDB, has finally landed. If you’re curious to learn more about the hows and whys of its design, check out this GrafanaCon EU session with InfluxData Cofounder and CTO Paul Dix. Also we’d like to share a recent presentation from David Kaltschmidt, Director, UX for Grafana Labs on the new Flux support in Grafana!