Operations | Monitoring | ITSM | DevOps | Cloud
Latest News
Monitoring and Troubleshooting Containerized Applications with Lumigo
Modern applications are designed to leverage cloud native technologies like serverless and containers to run at an unprecedented scale, moving the focus away from machines to the actual service. Lumigo’s observability platform was purpose-built for these evolving cloud environments, and we’ve been delivering the most advanced automated distributed tracing for serverless applications since 2019.
Mattermost v7.0 is now available
Mattermost v7.0 is generally available today and includes three of our top five most requested features, based directly on your input in our feature idea forum. The following new features are all included (see changelog for more details).
Annual Study: Hybrid IT Acceleration Has Increased Network Complexity and Lowered Tech Pros' Network Management Confidence
Site Reliability Engineering (SRE) Survey Now Open for 2022 - Calling All Reliability Practitioners and Leaders
Ribbon and DSTNY Automate Support Microsoft's Operator Connect Accelerator
Stackify Earns SD Times 100: Best in Show for Performance Monitoring
Stackify earned top honors for the 4th year in a row from SD Times for Performance Monitoring. This year’s SD Times 100 looks at the best of the software development companies from how they performed in 2021 — a year like no other due to … Improve Your Code with Retrace APM Stackify’s APM tools are used by thousands of.NET, Java, PHP, Node.js, Python, & Ruby developers all over the world. Explore Retrace’s product features to learn more.
Introducing Grafana OnCall OSS, on-call management for the open source community
Last November, we announced the launch of Grafana OnCall, an easy-to-use on-call management tool that helps reduce toil through simpler workflows and interfaces tailored for developers. Born out of Grafana Labs' acquisition of Amixr Inc., Grafana OnCall began as a cloud-only solution that became generally available to all Grafana Cloud users, on both paid and free plans, in February.
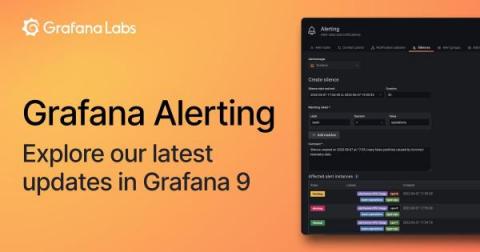
Grafana Alerting: Explore our latest updates in Grafana 9
Grafana 8 marked a major redesign in the way we do alerting. We created a unified alerting experience that implemented a workflow that operates across all of our products and combined Grafana panel alerts and Prometheus-style alerts into a single pane of glass. We built this as an open source feature first to make sure you could opt in and try it out from day one, regardless of which flavor of Grafana (OSS, Cloud, or Enterprise) works best for you.
Grafana 9.0: Prometheus and Grafana Loki visual query builders, new navigation, improved workflows, heatmap panels, and more!
GrafanaCONline, our annual community event designed for Grafana open source users and dashboarding enthusiasts, also marks the general availability of Grafana’s latest and greatest release. Grafana 9.0 is now available to both open source and Grafana Enterprise users, and is being rolled out to Grafana Cloud users incrementally. (The majority of instances have already been upgraded!) New Grafana Cloud users will immediately get the Grafana 9.0 experience.


