Operations | Monitoring | ITSM | DevOps | Cloud

Latest Posts

Is SquaredUp Dashboard Server an easy alternative to Grafana?

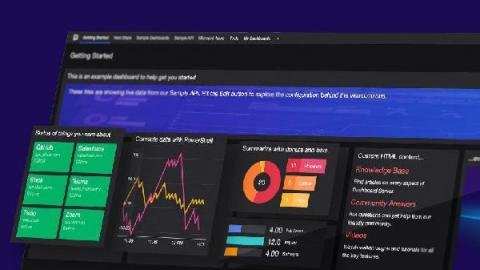
Grafana is free and powerful - a mainstay in DevOps and IT dashboarding. It’s an open-source visualization platform that lets you visualize data in real-time from almost any database. SquaredUp Dashboard Server is, at first glance, quite similar! You can dashboard just about any data to get real-time visualizations. All for free. So… The answer is… Yes, if you want enterprise scale dashboards hosted on Windows Server that are super-fast to set up (and usable by anyone).

Is SquaredUp Dashboard Server the effortless alternative to Grafana?

Grafana is free and powerful - a mainstay in DevOps and IT dashboarding. It’s an open-source visualization platform that lets you visualize data in real-time from a variety of data sources. SquaredUp Dashboard Server is, at first glance, quite similar! You can dashboard just about any data to get real-time visualizations. All for free.

2 reasons you need Dashboard Server with SquaredUp Connect or EAM

We’ve seen how much you love SquaredUp. But we’re also aware that opening up access to your SCOM and Azure data can sometimes hold you back from sharing the joy of powerful dashboarding with other teams. And what about trying to get an overview of multiple SCOM management groups without having to log into each one individually? We have the perfect solution for both problems.

Dashboard Server: Working with the Elasticsearch Tile

I’ll come clean and admit it – this part of the series will be a bit interesting given the fact that I know very little about Elasticsearch. So really, this is an honest test of the question – “can I still build something good with Dashboard Server even if I only have nominal knowledge of the tool where the data is sourced from?”

New: Dashboard Server Enterprise version

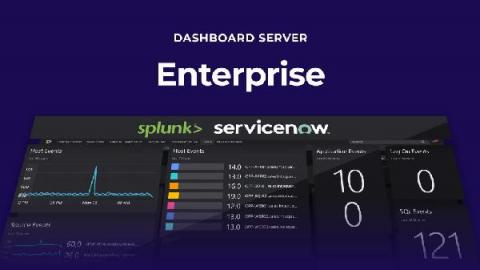
In April, we brought you the ability to dashboard any data with the new SquaredUp Dashboard Server product – for free. Then at SquaredUp Live, we announced the launch of Dashboard Server Enterprise for enterprise organizations who have got to grips with their dashboarding and now want to scale up. You can purchase unlimited named users and get endless data connections plus new, enterprise integrations that let you dashboard just about anything.

SquaredUp 5.1 is here

We are delighted to announce that SquaredUp 5.1 is now available! With this latest update, we are introducing new integrations and visualizations that extend the picture of your business services and applications by unlocking even more of your data that is trapped within silos. You can now get insights on your enterprise applications from any angle! These features are available in all our products, including our newest product Dashboard Server.

Dashboard Server: Working with the SQL tile

In my previous blogs in the Dashboard Server Learning Path, we looked at working with the Web API tile and the PowerShell tile. In this instalment, let’s try the SQL tile. This tile will let you connect to any SQL database and run a SQL query straight from SquaredUp. This tile is also available in both the SquaredUp for SCOM and Azure products, so I have some familiarity with it already.

Dashboard Server: Working with the PowerShell tile

Amongst all the cool features of SquaredUp Dashboard Server, the coolest kid on the block is probably the PowerShell tile. The reason is simple – PowerShell is easy, it’s awesome, and it’s powerful! You can not only retrieve data from the source (like the APIs), but you can also manipulate that data, work with variables, loop it, filter it, and use it in whichever way works the best. Like they say, the things PowerShell can do are only restricted by the proficiency of the user.

The benefits and challenges of a single pane of glass

SCOM 2019 is a monitoring powerhouse. Its capabilities are unmatched. But it also has some serious issues when it comes to unearthing and visualizing the valuable data locked inside. The replacement of Silverlight with HTML5 in the SCOM 2019 web console was a welcome enhancement, but the SCOM web console still shares its design with the administration console, which is slow, complex, and makes it downright difficult to get the visibility you need.

How to build insightful M365 Analytics Dashboards with SquaredUp and Microsoft Graph API (Part 2)

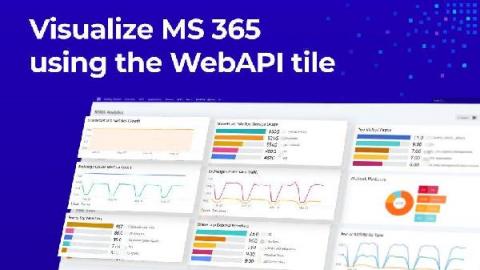
In the last blog post, I walked you through how to connect to the Microsoft Graph API so you can start pulling in the M365 analytics to create a dashboard in SquaredUp. In this blog post, I’ll walk you through exactly how to create this dashboard. This dashboard will allow you to monitor key metrics for Microsoft 365 SharePoint, Exchange Online, and Teams so you can be proactive in assigning storage.