Operations | Monitoring | ITSM | DevOps | Cloud

Latest Posts

Kusto: Table Joins and the Let Statement

In this article I’m going to discuss table joins and the let statement in Log Analytics. Along with custom logs, these are concepts that really had me scratching my head for a long time, and it was a little bit tricky to put all the pieces together from documentation and other people’s blog posts. Hopefully this will help anyone else out there that still has unanswered questions on one of these topics.

Kusto: Custom Logs in Log Analytics

In this article, I’m going to discuss custom logs in Log Analytics. Along with table joins and the let statement that I discuss in another blog, custom logs is a concept that I struggled to wrap my head around for a long time, as there don’t seem to be very many comprehensive guides out there as of yet. Here is a summary of everything I have managed to piece together from documentation and other people’s blog posts.

How to build the ideal dev team dashboard

So you’ve now finally finished putting all the pieces together – transitioned to Azure, deployed resources, deployed applications, got familiar with Azure Monitor and set up all the monitoring. You’re now collecting all the monitoring, application performance and security data for your Azure resources in Log Analytics workspaces, ready for analysis. (Head over to our Azure Monitor Learning Path if you're still figuring out how to do all that.) But is only the collection enough?

Looking ahead: SquaredUp 5.0 and beyond

Welcome to 2021, a year we are all entering full of hope. None of us knows quite what 2021 holds in store with regards to the global pandemic, but no doubt it will be another year of huge change. That will mean continued pressure on IT organizations across all industries to adapt and deliver new services to the business and users, all while keeping costs as low as possible. As we start a new year, many of you reading this will be considering your monitoring strategy in 2021 and beyond.

Working with On-prem machines in SquaredUp for Azure

If you’ve been using SquaredUp for Azure, you’re familiar with its abilities to treat Azure native virtual machines . You can create a number of amazing and useful visualizations with them, such as displaying their health state, performance charts, costs, and so on. This is all excellent and super useful, but one question we frequently get asked is: how do I do these things with my on-prem servers that I’ve connected to Azure Monitor?

Introducing Azure Management Talk

Happy New Year everyone! We are thrilled to be starting 2021 with some exciting news. Come February 2nd, we’ll be kicking off Azure Management Talk, a bite-sized webinar series with a focus on all things Azure management. Azure is fast-evolving, and often, it can get quite complicated. With so many things to learn and not enough time, the huge swathes of learning resources available online can quickly get overwhelming.

On/Off NOC Dashboards with SquaredUp

How do you define your workday? You walk into your office, grab a coffee, turn on your laptop and take a look at your central source of information – often dashboards – to glance at things happening overall, tasks assigned to you and sketch your schedule accordingly. A lot of our customers we talk to share a routine like this, and SquaredUp dashboards are often their one-stop-shop for consuming alerts/tasks that need their attention.

Why choose the Connect license for SquaredUp 5.0?

Every enterprise has its arsenal of tech tools to tackle an array of different challenges. Useful, and necessary, but often a pain to monitor. Whatever your data sources, being able to bring all these metrics into a unified dashboard provides valuable context, which in turn helps you identify and correlate problems more quickly, resulting in improved reaction time and decision making.

New and improved Web API tile with SquaredUp 5.0

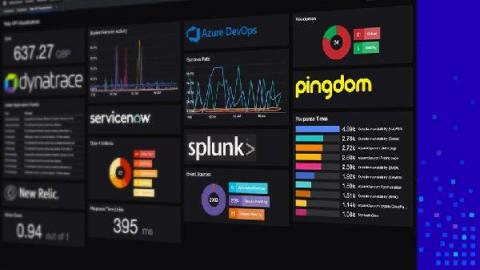
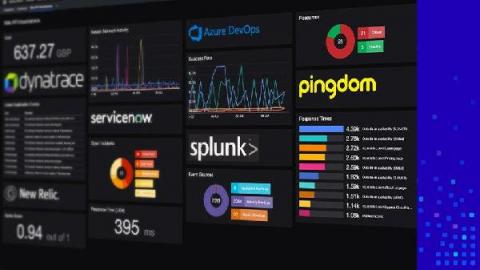
Being able to visualize data from all of your tools in a unified dashboard experience has become critical to most enterprises today. With SquaredUp dashboards, you can not only correlate data from SCOM and Azure, but also surface critical information from your other tools and data sources – including ServiceNow, Azure Log Analytics, App Insights, all SQL databases and any Web API. In short, you can get unified dashboards with real-time operational intelligence for all teams across all tools.

New Open Access with SquaredUp 5.0

Our Open Access feature enables easy, and unlimited sharing of dashboards across your organization – with any audience at all. A highly popular feature, these shared dashboards help you bring better visibility and collaboration – conveying the shared “truth”! With our latest release SquaredUp 5.0, we have made Open Access dashboards fully interactive, like the rest of our dashboards, so you can see that next level of detail you’ve been wanting.