Operations | Monitoring | ITSM | DevOps | Cloud

Latest Posts

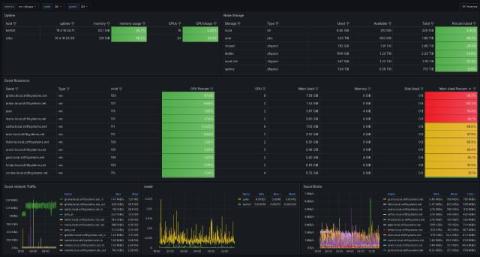
Monitoring Azure AKS & Azure Linux with VictoriaMetrics

Azure linux is a Linux distribution built for Microsoft’s cloud infrastructure. It can be used as a base OS when creating node pools in Azure Kubernetes Service (AKS) clusters. Using Azure linux as a base OS for AKS node pools has several benefits, such as lower resources footprint, faster boot times, and better security.

The Rise of Open Source Time Series Databases

Time series databases allow you to store and query metrics efficiently. For example, if you want to forecast load on your servers, or identify intermittent faults with your production services, time series databases can help. Besides infrastructure monitoring, time series databases have been invaluable in finance, IoT applications, manufacturing, and more. Many time series databases, including VictoriaMetrics, are open source.

Open Source Software Licenses vs Revenue Growth Rates

I don’t understand why pure open-source licenses, such as Apache2, MIT or BSD, should be replaced with a source available license in order to increase profits from enterprise support contracts. That’s why we at VictoriaMetrics aren’t going to change the Apache2 license for our products. Our main goal is to provide good products to users, and to help users use these products in the most efficient way.

VictoriaMetrics Cloud reduces monitoring costs by 5x

We’re happy to announce VictoriaMetrics Cloud, a hosted monitoring platform and managed service for metrics that allows organizations to monitor and store large amounts of time-series data, without having to run the underlying infrastructure. At a time when almost every enterprise relies on complex data to run, VictoriaMetrics Cloud delivers the power of the popular VictoriaMetrics open-source time series solution, which has reached 750 million downloads, with enterprise features.

Troubleshooting Time Series Databases: Where Did My Metrics Go?

Complex modern applications rely heavily on observability, and metric monitoring is a crucial part of observability. The most common process of metric monitoring, which includes data scraping, processing, storage, and visualization, can be summarized in the diagram below: If an issue arises, for example, when users ask, “I have already recorded metrics in the application, why can’t I see my metrics on Grafana?”, how should we troubleshoot it?

VictoriaMetrics Anomaly Detection: What's New in H1 2024?

With this blog post, we are excited to introduce a quarterly “What’s New” series to inform a broader audience about the latest features and improvements made to VictoriaMetrics Anomaly Detection (or simply vmanomaly). This first post will cover both Q1 and Q2 of 2024. Stay tuned for the next content on anomaly detection.

Q2 2024 Round Up: VictoriaMetrics & VictoriaLogs Updates

Many thanks to everyone who joined us for our recent virtual meetup, during which we discussed some of our Q2 2024 highlights, including features highlights, the 2024 roadmap for VictoriaMetrics and all the latest news on VictoriaLogs! In this blog post, we’d like to share a summary of these highlights.

Introduction to Managed Monitoring

Monitoring, in the context of software, is a catch-all term for visibility into infrastructure, or an application. It can encompass metrics, logs, traces, and any other telemetry data that provides information on a running application, server, or another device. Monitoring helps you catch problems before your customers do and speeds up the time to resolution for any problems that do slip through. Managed monitoring is where another company runs part or all of your monitoring system.