Operations | Monitoring | ITSM | DevOps | Cloud

Latest Posts

CNCF Live: Power up your machine learning - Automated anomaly detection

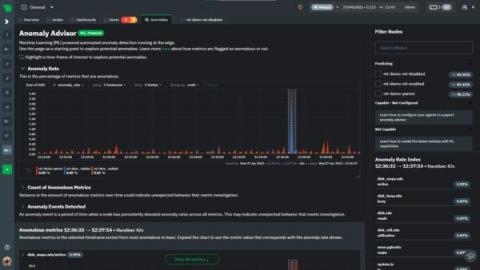
Our Analytics & ML lead Andrew Maguire recently had a chance to share our new Anomaly Advisor feature with the wider CNCF community. In his demonstration he did some light chaos engineering (using Gremlin and stress-ng) to generate some real anomalies on his infrastructure and watch how it all played out in the Anomaly Advisor in Netdata Cloud. There were also some great questions and discussion from the audience around ML in general and in the observability space itself.

The Netdata Way of Troubleshooting

Together with you, our fabulous community, Netdata is changing the way the world thinks of high fidelity monitoring – and we are gaining momentum. Our chief troublemaker and CEO, Costa Tsaousis, is the pioneer and architect of this revolution that’s brewing in the monitoring and troubleshooting space. Watch him explain the Netdata way of troubleshooting.

Our Approach to Machine Learning

There is a lot of buzz in the world of machine learning (ML) and as a layperson it can be hard to keep up with it all. Therefore, we decided to write down some of our thoughts and musings on how we are approaching ML at Netdata. We’ll touch on the current state of applied ML in industry in general, and zoom in on ML in the monitoring industry.

All-new Netdata Cloud Charts 2.0

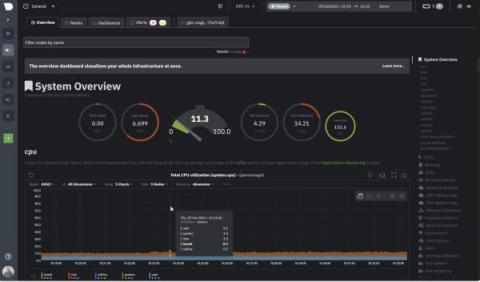
Netdata excels in collecting, storing, and organizing metrics in out-of-the-box dashboards for powerful troubleshooting. We are now doubling down on this by transforming data into even more effective visualizations, helping you make the most sense out of all your metrics for increased observability. The new Netdata Charts provide a ton of useful information and we invite you to further explore our new charts from a design and development perspective.

How to extend the Geth collector

This is the the last of a 2-part blog post series regarding Netdata and Geth. If you missed the first, be sure to check it out here. Geth is short for Go-Ethereum and is the official implementation of the Ethereum Client in Go. Currently it’s one of the most widely used implementations and a core piece of infrastructure for the Ethereum ecosystem. With this proof of concept I wanted to showcase how easy it really is to gather data from any Prometheus endpoint and visualize them in Netdata.

Root cause analysis using Metric Correlations

As complexity of systems and applications continue to evolve and change, the number of metrics that need to be monitored grows in parallel. Whether you’re on a DevOps team, an SRE, or a developer building the code yourself, many of these components may be fragmented across your infrastructure, making it increasingly difficult to identify the root cause when experiencing downtime or abnormal behavior.

How to monitor your disks and filesystems, now also with eBPF

Current IT monitoring software lacks the necessary metrics for minimizing downtime for systems and applications. Most provide system and application metrics but there is much more than this required for properly monitoring your infrastructure. With eBPF there is a technological advancement that allows monitoring software to provide rich information from the Linux kernel and present it.

Netdata is launching its Discord server

It’s been a long time since our last community update, rest assured that we have been hard at work here at Netdata. Community building is hard, especially when you have such a venerable community like the one here at Netdata, where hundreds of contributors have contributed to creating one of the best monitoring solutions that exist. Last year we started to concentrate working on consolidating the community by integrating the various platforms where people come together to talk about Netdata.