Operations | Monitoring | ITSM | DevOps | Cloud

Latest Posts

Revoke certificate of an Icinga endpoint

A Certificate Revocation List (CRL) is a list of certificates that have been revoked by the issuing Certificate Authority (CA) before their scheduled expiration date. Those certificates should no longer be trusted. A client application such as an Icinga Agent can use a CRL to verify that the certificate of the server is valid and trusted.

Using the Icinga Web API

Unfortunately, there is little to no documentation for using the Icinga Web API to perform monitoring actions such as scheduling downtimes. But it’s a simple thing and I’ll give you a quick example of how to do it. Using the Icinga Web API instead of the Icinga API gives you the advantages of the permission and restriction system, various authentication methods and auditing.

Using Thola for monitoring your network devices

Once upon a time there was a small company in the south west of Germany that used an old check plugin for monitoring its network devices. But as their network got bigger and bigger over time, the plugin (written in Perl) became more greedy than ever before and swallowed all of the available resources. The CPUs were melting and the RAM was about to collapse. So a small team of creative software developers decided to take the fate of their company into their own hands.

How to connect to the Icinga 2 API via the Icinga Console

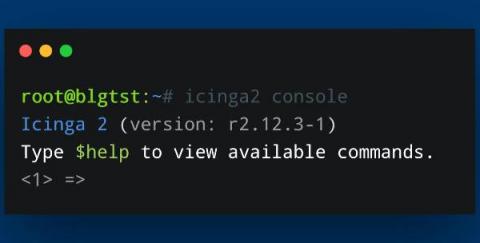
Today I will show you a couple of small functions you can use with the Icinga Console. Using the Icinga Console can help with scripting in general and provides a quick and easy-to-use way of extracting information from your Icinga environment. We will take a look at extracting information belonging to the service objects in Icinga. Obviously, you can pinpoint different objects, like host objects, with which you can work via the Icinga 2 API and Console.

Creating dashboards based on custom filters

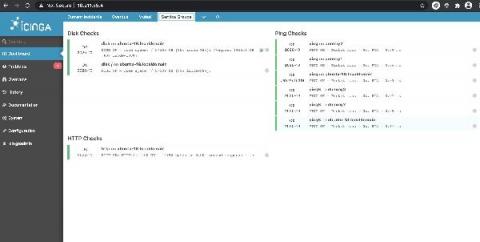
In this blogpost, I explain how to create dashlets using custom filters. This way you can create dashlets of your own which you find is necessary. Having dashboards in fact improves monitoring. Dashlets are the different sections under the given dashboard, which are the snapshots of some monitoring views and are defined by a name. Requirements: Icinga 2 and Icinga Web 2 installed.

Icinga 2 Config Sync: DIY Edition

Two weeks ago, Icinga 2 Config Sync: Behind the Scenes explained how the config sync in Icinga 2 works and how you can look behind the scenes. Today, we will put our knowledge from that post to the test and try to manually replicate the config sync. The most important takeaways will be recapped in this post, but if you are interested and have the time, the other post is also worth a read.

Icinga for Windows - Hyper-V and Cluster Plugins Preview

Today we finally have great news to share for everyone using Icinga to monitor Hyper-V and Windows Cluster environments. For quite some time we’ve been working on multiple new plugins to provide better monitoring option for Hyper-V and Windows Cluster. The new plugins are based on our PowerShell framework provided by Icinga for Windows. For the new plugins we decided to provide a preview first, in favour of a final release.

Icinga 2 Config Language (DSL): Advanced Apply Rules

As many users of Icinga don’t know what the DSL has to offer, I’m going to show you how to use custom variables and apply for rules to make your life easier when writing configuration for your Icinga environment. In this example we will use custom variables on a host to configure a dynamic set of services to monitor multiple web services behind a reverse proxy. On the host we define a custom dictionary called http_vhosts and assign our virtual hosts to it.