Operations | Monitoring | ITSM | DevOps | Cloud

Latest Posts

A to Z With Observability and OpenTelemetry

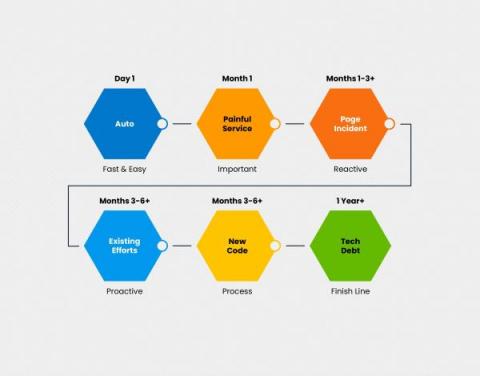
How do you go from A to Z with observability and OpenTelemetry? This post answers a question we hear often: “How do I get started on instrumentation with OpenTelemetry, while also following best practices for the long-term?” This article is all about taking you from A to Z on instrumentation. This will help you: We will use a simple greeting service application written in Node.js to understand the journey. You can find the pre-instrumented state here.

Top Takeaways from Monitorama 2022

Since 2013, Monitorama has been a community-driven conference, bringing together open source development and operations engineers to focus on pushing the boundaries of monitoring software and practices. It’s chock full of thought-provoking content in the conference talks. The casual atmosphere also makes the hallway track a great way to network with fellow engineers and vendors alike to pick up on new developments in the monitoring space.

On Counting Alerts

A while ago, I wrote about how we track on-call health, and I heard from various people about how “expecting to be woken up” can be extremely unhealthy, or how tracking the number of disruptions would actually be useful. I took that feedback to heart and wanted to address the issues they raised, and also provide some numbers that explain the position I took with these metrics on alerts.

We Learn Systems by Changing Them

It is only possible to come to an understanding of a system of interest by trying to change it. Here, Jackson contrasts action research with old-style hard science, which tries to study a system from the outside. Laboratories draw a line between experiment and scientist. In the social world, there is no outside: we participate in the systems we study. I’ve noticed this in code: when I come to an existing codebase, I get a handle on it by changing stuff.

How to Save on Monitoring Costs by Using Honeycomb

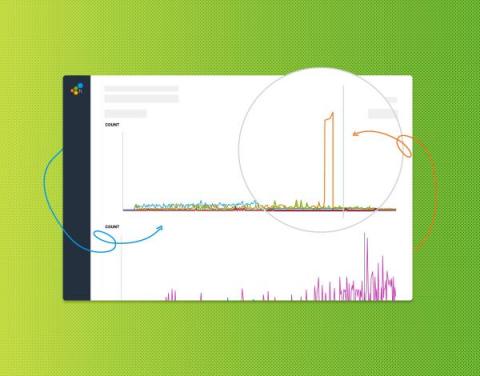
Are you overspending on monitoring and APM tools? Forrester’s Total Economic Impact analysis of Honeycomb identified significant ROI in customers using us to reduce spend on less efficient APM workflows. But this isn’t about budget reallocation to a newly branded set of similar but shinier tools.

Authors' Cut-How Observability Differs from Traditional Monitoring

Remember the old days where if you had an uptime of 99.9 you could be fairly confident everyone was having a good experience with your application? That’s not really how it works anymore. Modern, distributed systems are so complex they typically fail unpredictably, making it much harder to diagnose issues. Traditional monitoring grew out of those early days, allowing you to check the health of simpler systems.

Exploring AWS Costs Beyond the Service Level

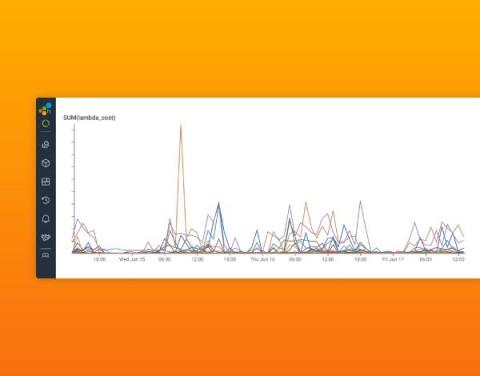
Honeycomb uses AWS Lambda as a core part of our query execution architecture; Lambda’s ability to quickly allocate lots of resources and charge us only for use is invaluable to keeping Honeycomb fast and affordable. Our total Lambda bill is easily accessible in the AWS Console, but how do we know which customers or application areas dominate this bill? How do we judge the cost of changes we make to our own software?

Webinar Recap: How to Avoid Being On Call With Under-Instrumented Tools

“It’s too expensive!” “Do we really need another tool?” “Our APM works just fine.” With strapped tech budgets and an abundance of tooling, it can be hard to justify a new expense—or something new for engineers to learn. Especially when they feel their current tool does the job adequately. But, does it?

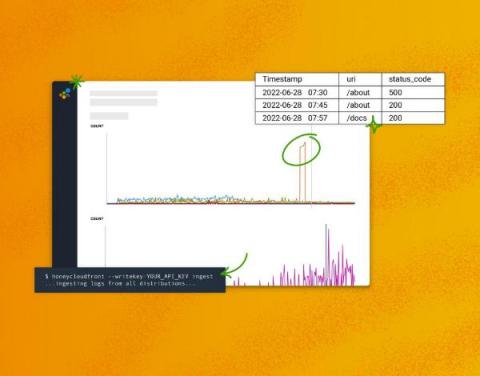
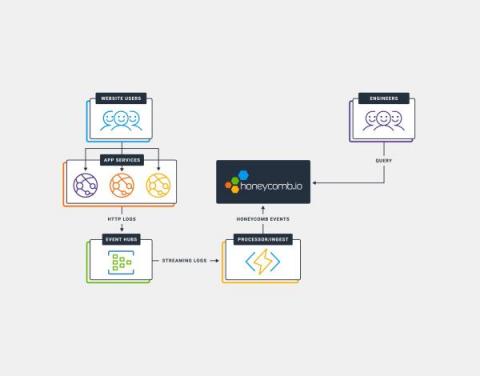
Ingesting HTTP Access Logs from AppService

Debugging application performance in Azure AppService is something that’s quite difficult using Azure’s built-in services (like Application Insights). Among some of the issues are visualizations, and the time it takes to be able to query data. In this post, we’ll walk through the steps to ingest HTTP Access Logs from Azure AppService into Honeycomb to provide for near real-time analysis Access Logs.