Operations | Monitoring | ITSM | DevOps | Cloud

Latest Posts

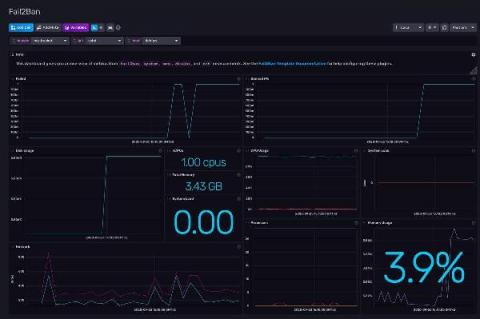
Fail2ban Monitoring with InfluxDB and Telegraf

If you have a server open to the internet on Port 22 (the default port for SSH servers), it’s common to find several “Failed password” in your auth.log (log file) every minute, due to bots constantly browsing the internet for servers that are easy to hack with common passwords. But if your auth.log is growing very fast and SSH daemon randomly refuses to create new connections, then someone probably marked your server as a target for coordinated SSH brute-force attack.

Trending Aggregate Values by Downsampling with InfluxDB

InfluxDB is great at capturing many kinds of metrics and allowing end users to aggregate those metrics to custom time groupings whether you’re watching IoT devices perform at 10-minute intervals, GitHub repositories issues close over weeks, or web performance metrics over seconds. Dashboards provide that information at a glance, at precisely the intervals you’ve determined. But what about the next level?

Running InfluxDB 2.0 and Telegraf Using Docker

While the Docker buzz has faded a bit, replaced by new words like “Kubernetes” and “Serverless”, there is no arguing that Docker is the default toolchain for developers looking to get started with Linux containers, as it is fairly ubiquitous and tightly integrated with a variety of platforms.

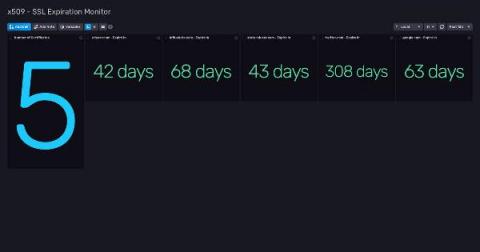
Automating SSL Certificate Expiration Monitoring

In my previous work experience, monitoring certificate validation was critical to our team. These certificates were used to sign commercial transactions between the payment gateway (us) and other providers. That check was manual and depended on the calendar of one person. So, if that person forgets to notify the team about the upcoming expiration of one certificate and doesn’t start the procedure of getting the new one, well, the platform starts to fail.

InfluxData closes 2020 with exponential cloud growth, expanding user base, and big new customers

SAN FRANCISCO — January 14, 2021 — InfluxData, creator of the time series database InfluxDB, today announced significant growth in 2020 across its cloud business, open source user base, and major new customers. Demand for the time series platform continued to climb across industry sectors, especially for IoT and data streaming use cases.

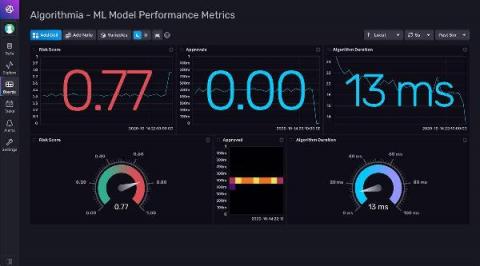
Algorithmia ML Model Performance Visualization Made Easy with This InfluxDB Template

Measuring your machine learning model will help you understand how well your model is doing, how useful it is, and whether your model can perform better with more data. This is what Algorithmia Insights — a feature of Algorithmia Enterprise MLOps platform — does. Algorithmia platform accelerates your time to value for ML by delivering more models quickly and securely, as it is estimated that 85% of machine learning models never make it to production.

How Strivve is Helping Credit Card Issuers Capture Lost Revenue and Gain Visibility

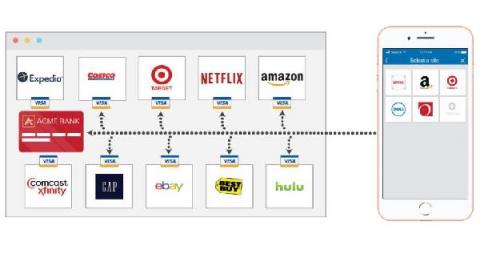
“We all get our credit cards replaced a lot. Our online ecosystem is getting more complex with the number of accounts we have. We wanted to simplify that, and make it less complicated to get those cards back on file,” says Katherine Chavez, Director of Marketing for Strivve (formerly Switch, Inc.). Strivve is a startup that aims to take the pain out of updating credit and debit cards by automating the updating process.

Network Usage Visibility from the Free InfluxDB sFlow Monitoring Template

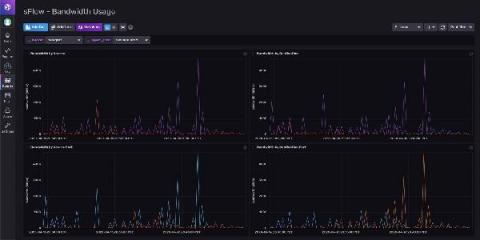
As business-critical applications increasingly rely on network services, even a minor change in network usage can impact network performance and reliability, thereby also impacting business functions and network maintenance costs. sFlow (short for “sampled flow”) — by providing unprecedented visibility into network usage and active routes of high-speed and complex networks — delivers the data needed to effectively control and manage network usage.

Monitoring Telegraf Plugins in Your Architecture

Monitoring Telegraf — the open source, plugin-driven server agent for collecting metrics from stacks, sensors and systems — is important because it allows you to track the health of Telegraf plugins in your stack. It’s for this purpose that the Telegraf Monitoring Template was developed. Before introducing the template, it’s helpful to recall how Telegraf works.