Operations | Monitoring | ITSM | DevOps | Cloud

Latest Posts

Introduction to Giraffe

Giraffe is InfluxData’s graphing library, built to use and graph the data coming from InfluxData’s time series database, InfluxDB. Yes, there are other graphing libraries available; but ours is the only one purpose-built to graph line protocol without having to convert it. Plus, we have lots of great features, like legends and colorization, without much configuration. So, how to get started?

Getting Started with Time Series Data Science

Are you interested in performing time series forecasting or anomaly detection, but you don’t know where to start? If so, you’re not alone. There is an overwhelming variety of libraries, algorithms, and workflow recommendations for these tasks. As a Developer Advocate at InfluxDB, the leading time series database, I’ve researched time series data science methodologies and best practices for forecasting and anomaly detection.

TL;DR InfluxDB Tech Tips: Debugging and Monitoring Tasks with InfluxDB

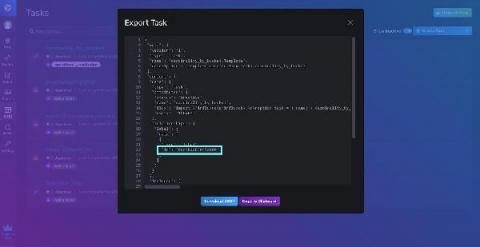
With InfluxDB you can use Tasks to process data on a schedule. You can also use tasks to write custom alerts. However, sometimes your task will fail. In this TLDR, we’ll learn how to debug your task with the InfluxDB UI and the InfluxDB CLI.

TL;DR InfluxDB Tech Tips - Time Series Forecasting with Telegraf

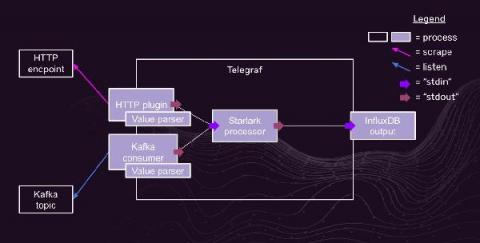
If you’re familiar with Telegraf, you know that you can easily configure this lightweight collection agent with a single TOML configuration file to gather metrics from over 180 inputs and write data to a wide variety of different outputs and/or platforms. You might also know that Telegraf can act as a processor, aggregator, parser, and serializer.

JSON to InfluxDB with Telegraf and Starlark

Data platforms — or databases with sets of APIs for flexibly working with data — are quintessential backbones for those who rely heavily on being able to change how they obtain data and work with their data over time. A good data platform will provide you the necessary tools to glean the insights you need to solve tangible problems. That platform should also hopefully make it so you don’t have a bad time doing it!

The Future of InfluxDB OSS: More Open, Permissive with Complementary Closed Source

I was recently on the Changelog Podcast talking about Elastic’s recent change away from open source licensing. I’m at 1:02:45 to 1:24:03, but the whole thing is pretty interesting if you have time to listen. This is where #InfluxDB is headed. No more open core, we're going to a combination of cloud offering, or if on-premise, a complementary offering to the open source. It'll take us time to get there, but that's the vision. Commercial complements the open source rather than replace.

Monitoring DigitalOcean Billing with InfluxDB

I’ve always had a good experience using DigitalOcean, a cloud infrastructure provider which offers developers cloud services that help deploy and scale applications that run simultaneously on multiple computers. I’ve used DigitalOcean a lot for my personal projects — for example, to host my personal blog, its stats, and a NextCloud instance, all running in Kubernetes.

InfluxDB C Client Library for Capturing Statistics

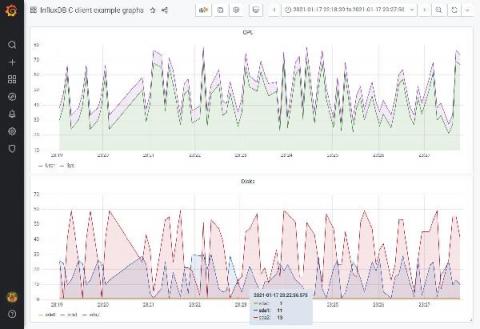
Currently, there is no official InfluxDB C language client library. Fortunately, I wanted to do exactly that for capturing Operating System performance statistics for AIX and Linux. This data capturing tool is called “njmon” and is open source on Sourceforge. So having worked out how and developing a small library of 12 functions for my use to make saving data simple, I thought I would share it. I hope it will prove useful for others.

A Partnership Between InfluxData and Ockam Brings Trust to Time Series Data

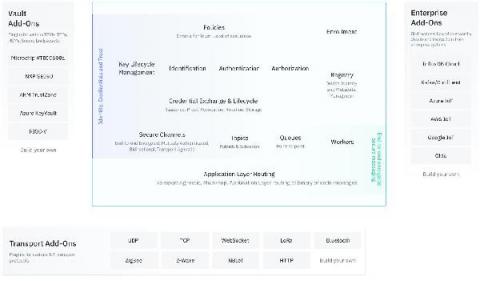
This article is a re-post of the article written by Matthew Gregory and published on the Ockam blog. Let’s investigate how to build applications with trusted time series data in a zero trust environment! To trust an application we need to trust the data that feeds into it. Increasingly, applications rely on time series data from outside the datacenter, at the edge, or in IoT. This means we need to think of trust and data in new ways.

Monitoring InfluxDB 2.0 in Production and at Scale

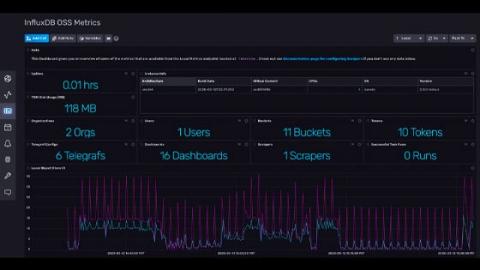
One of the great things about InfluxDB is that it is really easy to get up and running, and it doesn’t require much monitoring when you are dealing with datasets that fit well on your local dev machine. Once you start using InfluxDB in production and pushing orders of magnitude more data into the system, it’s critical to monitor how your instance is performing so that you can proactively respond to things like disk or network failures, memory saturation, and write or query loads.