Operations | Monitoring | ITSM | DevOps | Cloud

Latest Posts

Complete Guide: What Are Dedicated Devices?

Dedicated devices are vital tools for businesses looking to optimize their operations, and unlike general-purpose devices, they are engineered to perform specific tasks such as Point-of-Sale (POS) and medical monitoring. In this guide, we’ll explore what dedicated devices are, how they work, and hardware selection best practices that will ensure you get the most from your IT investments.

8 DevOps Automation Best Practices for Startups

Automation is the foundation of any successful DevOps strategy, especially for startups and fast-growing companies. Manual processes simply don’t scale as the business grows, leading to delays, errors, and frustration. For organizations striving to optimize efficiency, speed up development, and maintain high-quality standards, DevOps automation is a must.

4 New Ways to Improve Incident Management with Event Orchestration

In an era where efficiency and smart technology integration are key, 71% of technical leaders report their companies are expanding their investments in artificial intelligence (AI) and machine learning (ML) this year. With the sheer volume of data coming into the enterprise and the need for timely response, monitoring every incoming alert around the clock is impractical, and human vigilance alone is too imprecise.

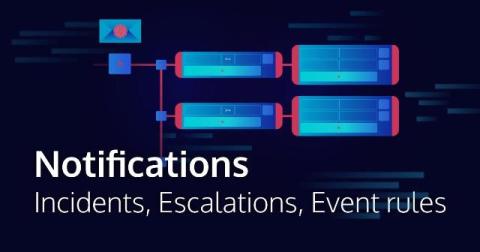
Icinga Notifications: Incidents, Escalations, and Event Rules

Following the Icinga Notifications beta announcement, we already had a more general post on how to get started and one going into the details of schedules. This week’s blog post is a follow up in this series and will describe incidents, escalations, and event rules in Icinga Notifications in more detail. In case you haven’t seen the first two referenced blog posts, you might want to have a look at them first, otherwise, you could miss out on the big picture.

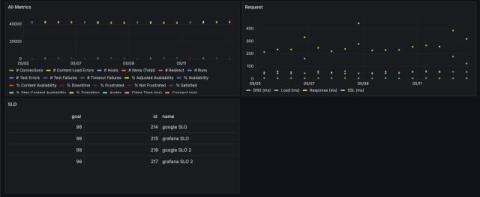
The Catchpoint Enterprise data source for Grafana: key features and how to get started

Earlier this year, we were thrilled to announce that Catchpoint is now available as an Enterprise data source for Grafana! With the public preview release of the Catchpoint Enterprise data source, you can seamlessly bring Catchpoint’s extensive Digital Experience Monitoring (DEM) and Internet Performance Monitoring (IPM) capabilities into your Grafana dashboards, enhancing your ability to visualize and analyze performance metrics in real-time.

New Relic vs Splunk - In-depth Comparison [2024]

New Relic and Splunk are two prominent tools in the world of observability and monitoring, each serving distinct purposes. New Relic is used for Application Performance Monitoring (APM), offering a full-stack observability platform. It is important to note that New Relic is not a SIEM tool, its primary focus is performance monitoring. On the other hand, Splunk is used for log management, machine data analytics, and is widely utilized as a SIEM tool.