Operations | Monitoring | ITSM | DevOps | Cloud

Latest Posts

Attach Screenshots to Your Playwright Test Reports

Today I want to show you how you can attach your screenshots directly to Playwright's test reports. Imagine you have a simple Playwright test that navigates to Checkly. You take a screenshot and store it in screenshots/home.png. Then, you click a link in the main navigation, expect a specific heading to be visible, and take another screenshot. When you run this test using npx playwright test, the test passes, and you find the screenshots in the /screenshots directory.

Deliver Peak Microsoft Teams Performance at Scale

Scale is a perennial challenge for most IT teams. While organizations expect the same performance and experience whether 500 users are accessing essential applications or 50,000, IT headcount rarely increases in proportion with organizational growth. This often leaves IT departments overtaxed and pressed to triage the most urgent concerns. But even that requires good data to inform decisions — which can be in short supply.

Release Roundup August 2024

Over the past year, the Gremlin team has focused on giving you more tools to adapt Gremlin to your organization’s reliability needs. We started with customizable reliability tests, and now, we’ve released customizable role-based access controls (RBAC). We’ve also made it easier to target specific availability zones when running Failure Flags experiments, and to run experiments behind a proxy. Keep reading to learn more! ‍

Microsoft Recall AI: Feature Release Update and Cybersecurity Concerns

Microsoft Recall AI is generating buzz, but not all of it is positive. When the feature was first introduced, the tech community was filled with excitement. However, concerns about privacy and data security quickly surfaced. While artificial intelligence (AI) promises convenience, it often comes at a cost—and in this case, that cost could be your privacy. As we look toward a future where AI powers more of our digital experiences, opinions are divided.

CVE-2024-21410: Ensuring Secure Firmware Updates in Industrial Devices

Security vulnerabilities are a serious issue for any organization. Even a single unpatched flaw can lead to disastrous consequences, including data breaches and loss of system integrity. CVE-2024-21410 is one such vulnerability that presents a significant risk. Found in a popular application used by many organizations, this flaw can leave systems exposed to attacks if not addressed promptly.

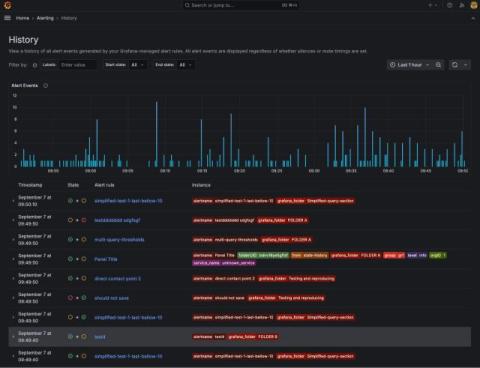
Better root cause analysis: Mastering alert insights with the new central history timeline

A year ago we rebuilt our alert rule state history, using Grafana Loki for storage and updating the UI to display a timeline of all state changes of an alert rule. As a result, users can now conduct better root cause analysis by going down to the level of an alert rule and seeing when certain alert instances started or stopped firing. But we aren’t stopping there. To ensure system stability and avert outages, you also need one place to see the state history for all the alerts in your system.

New Relic vs Grafana - 2024 Comparison

New Relic and Grafana are leading tools in monitoring and observability, each with distinct use cases. New Relic excels in Application Performance Monitoring (APM), providing detailed insights for application performance. In contrast, Grafana is designed for data visualization and monitoring, allowing users to create customizable dashboards for metrics and logs. This article provides a clear comparison of their features, including application performance monitoring, log management, and dashboards.

5 Automated GCP Optimizations That Make Cloud Cost Savings Simple

As both the State Of FinOps 2024 and the State Of Cloud Costs In 2024 indicate, reducing cloud waste remains a top priority for cloud-driven organizations. Cloud spenders care more than ever about cost efficiency — and CloudZero is working tirelessly to make cloud savings simpler. To this end, we’re proud to announce that we’ve added a suite of automated GCP optimizations to our Insights feature.

15 Application Monitoring Tools To Consider In 2024

Also known as application performance monitoring (APM), application monitoring tools track and analyze application performance. They monitor application metrics such as CPU usage, response times, error rates, and uptime. The tools also offer real-time insights to identify issues, improve user experiences, and optimize resources. But are APM tools really necessary?