Operations | Monitoring | ITSM | DevOps | Cloud
Latest Posts
What Observability Means to Digital Experience Monitoring
It would not be wrong to say that Observability is the new buzz word for the last couple of years at least and often we find organizations burden themselves with questions like – The answer to these questions lies in understanding the concept of Observability and how it ties in with the digital experience monitoring strategy of your organization and only then can you determine where you stand in terms of Observability.
Sending Nagios alerts to Microsoft Teams and rapid incident response with Zenduty
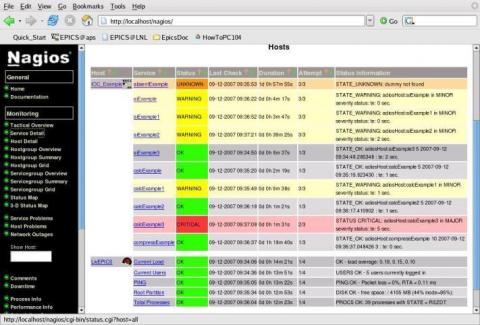
Nagios is one of the most widely used open-source network monitoring software used by thousands of NOC teams globally to monitor the health of a vast array of their hosts and services. Most teams rely on Emails as their primary Nagios alert notification channel, which may take a few minutes to respond to by your NOC team.
Byte Down Too: Build Cost Effective Infrastructure Like Netflix
Think of orgs with lots of data and it’s impossible to not think of Netflix. In a new Netflix Technology Blog, titled "Byte Down: Making Netflix’s Data Infrastructure Cost-Effective", their Platform Data Science & Engineering team describe their data infrastructure "which is composed of dozens of data platforms, hundreds of data producers and consumers, and petabytes of data.” At this scale, cost-effectiveness is a critical matter of success and failure.
Dogfooding for Deploys: How Honeycomb Builds Better Builds with Observability
Observability changes the way you understand and interact with your applications in production. Beyond knowing what’s happening in prod, observability is also a compass that helps you discover what’s happening on the way to production. Pierre Tessier joins us on Raw & Real to talk about how Honeycomb uses observability to improve the systems that support our production applications.
Splunk and the WEF - Working Together to Unlock the Potential of AI
Use of AI can be critical when developing systems to support social good, with some inspiring examples using Splunk in healthcare and higher education organisations. According to our State of Dark Data report, however, only 15% of organisations admit they are utilising AI solutions today due to lack of skills. So how can we help organisations unlock the potential of AI?
Using Observability as a Proxy for Customer Happiness
Today, users and customers are driven by response rates to their online requests. It’s no longer good enough to just have a request run to completion, it also has to fit within the perceived limits of “fast enough”. Yet, as we continue to build cloud-native applications with microservice architectures, driven by container orchestration like Kubernetes in public clouds, we need to understand the behavior of our system across all aspects, not just one.
How to Modernize Your Security Operations Center (SOC)
In an evolving world, the modernization of the security operations center (SOC) is pivotal to the success of digital transformation initiatives. Security teams, however, are facing a shortage of cybersecurity professionals and struggling to detect and prioritize high-priority threats. Analysts in data-driven organizations can combat these issues by bringing people, process and technology together.
Improve network security with traffic filters on Elastic Cloud
Today we are pleased to announce new traffic management features for Elastic Cloud. Now you can configure IP filtering within your Elastic Cloud deployment on Amazon Web Services (AWS), Google Cloud, and Microsoft Azure. We are also announcing integration with AWS PrivateLink. These features help give you greater control over the network security layer of your Elastic workloads.
Practical security engineering: Stateful detection
Detection engineering at Elastic is both a set of reliable principles — or methodologies — and a collection of effective tools. In this series, we’ll share some of the foundational concepts that we’ve discovered over time to deliver resilient detection logic. In this blog post, we will share a concept we call stateful detection and explain why it's important for detection.


