Operations | Monitoring | ITSM | DevOps | Cloud

Latest Posts

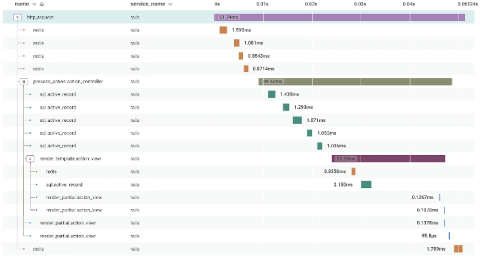
Unpacking Events: All the Better to Observe

At Honeycomb, we’ve been listening to your feedback. You want easier ways to predict usage and scale your observability spend with your business. What would it look like to meet you where you already are, using similar terms, and give you more control with a simpler experience? We think that means reimagining the customer experience into one that centers around an event-based model. But what exactly is an event? What does that mean for your team’s observability journey?

Approaching Kubernetes Security - Detecting Kubernetes Scan with Splunk

The Kubernetes framework has become the leading orchestration platform. Originally developed by Google, Kubernetes is a "platform for automating deployment, scaling, and operations of application containers across clusters of hosts" * . The kubernetes platform is used in all Cloud platform provider vendors as a tool that allows orchestration, automation and provision of applications and specific needs computing clusters and services.

Introducing template variable saved views for dashboards

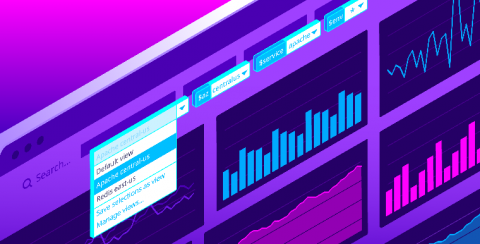
Datadog dashboards provide immediate visibility and insight into your environments. Setting template variables enables you to filter your dashboard graphs on the fly to visualize specific sets of tagged objects. Now, with saved views, you can save sets of frequently used template variables in order to easily find the data you most care about with just a few clicks.

SQL Server, Part 3: Adopting the principle of least privilege

In the previous blog in this series, we discussed authentication and authorization mechanisms, and how configuring them properly can help secure your databases. In this blog, we’ll talk about how data breaches can be prevented by implementing the principle of least privilege (POLP). According to Verizon’s 2019 Data Breach Investigations Report, insiders account for 76 percent of all compromised database records.

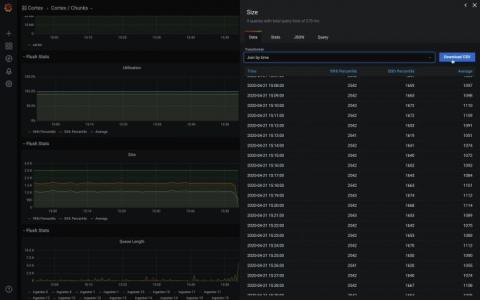
Grafana 7.0 sneak peek: Inspect drawer lets you get raw data and download as CSV

Grafana v7.0 is coming soon! Here’s another sneak peek of one of its features: the inspect drawer. The inspect drawer is a feature that every panel will support, including internal as well as external community plugins. In this new drawer, you will be able to view the raw data in a table format, apply some predefined transformations, and download as CSV. “Download as CSV” previously only existed as a custom feature for the Graph & Table panel.

How to Create Cost-Effective Infrastructure Monitoring

Out of the box monitoring solutions are getting more and more difficult to implement. In addition, they may not have the features you need, and they’re always becoming more expensive. It’s no wonder you’re trying to create a cost-effective solution via infrastructure monitoring cost management on your own by using a combination of your on-site development talent and a few open-source libraries.

5 small businesses making smart pivots for a world gone offline

According to research by small business marketing platform, FiveStars, customer visits to local businesses in the U.S. and Canada dropped by 70 percent between March 8 and April 12. It doesn’t take a statistician to realize that losing that many customers in one month represents a serious blow. But not every mom and pop shop is collapsing. With a significant amount of determination, creativity, and reskilling, some small businesses have found unique ways to reach their customers despite the chaos.

Using logging for your apps running on Kubernetes Engine

Whether you’re a developer debugging an application or on the DevOps team monitoring applications across several production clusters, logs are the lifeblood of the IT organization. And if you run on top of Google Kubernetes Engine (GKE), you can use Cloud Logging, one of the many services integrated into GKE, to find that useful information. Cloud Logging, and its companion tool Cloud Monitoring, are full featured products that are both deeply integrated into GKE.