Operations | Monitoring | ITSM | DevOps | Cloud
Latest Posts
13 Key Features Every Modern CI/CD Tool Should Contain
DevOps methodologies have become a huge staple of the Software Development Lifecycle. As such, more and more companies have been adopting the need for Continuous Integration/Continuous Delivery (CI/CD) tools. Building a successful CI/CD workflow can be a tedious process that requires your team to participate in a large amount of preparation and planning — but it doesn’t have to be that way.
Manage logs from multiple clouds and on-premises workloads together
We’ve heard from our customers that you need visibility into metrics and logs from Google Cloud, other clouds, and on-prem in one place. Google Cloud has partnered with Blue Medora to bring you a single solution to save time and money in managing your logs in a single place. Google Cloud’s operations management suite gives you the same scalable core platform that powers all internal and Google Cloud observability.
GitKraken vs Sourcetree
Software developers, students, and a few sea creatures have spoken. GitKraken is the most popular Git GUI in the world—named the most used graphical user interface for Git in the 2020 State of the Software Development Report. You might, however, be on the fence; maybe you’re Git-curious, but not sure whether to ‘commit’ (sorry) to a GUI. After all, there are several out there. Which one should you choose?
The Application Performance Monitoring Journey
One of the best parts of our job is enabling you to become the best #ITPerformanceHero that you can be. But behind the scenes, eG Innovations is filled with talented team members who wear their own IT Hero capes. We want to take some time to introduce you to some of the people who make eG Innovations the leading performance monitoring company on the market. We’re pleased to introduce Arun Aravamudhan, Head, APM and Web UX products.
Feature Spotlight: Auto-Tracing
Lumigo’s Auto-Tracing allows you to implement distributed tracing on your Lambda functions with 3-clicks and no manual code changes. If you’ve already decided to move to a serverless infrastructure, you probably understand the importance of monitoring your AWS Lambdas and what it might entail. For the few out there that are still wondering what monitoring AWS Lambda means, I’ll break it down for you in a couple of steps.
Getting Microsoft Azure Data into Splunk
If you're reading this, you're probably wondering how to get data from various Microsoft Azure services into Splunk. With the growing list of Azure services and various data access methods, it can be a little cloudy (pun intended) on what data is available and how to get all that data into Splunk. In this blog post, I'm going go over how Microsoft makes Azure data available, how to access the data, and out-of-the-box Splunk Add-Ons that can consume this data. So let's dive right in.
Splunk Attack Range Now With Caldera and Kali Linux
The Splunk Security Research Team has been working on new improvements and additions to the Splunk Attack Range, a tool that allows security researchers and analysts to quickly deploy environments locally and in the cloud in order to replicate attacks based on attack simulation engines. This deployment attempts to replicate environments at scale, including Windows, workstation/server, domain controller, Kali Linux, Splunk server and Splunk Phantom server.
Getting started with adding a new security data source in your Elastic SIEM: Part 1
What I love about our free and open Elastic SIEM is how easy it is to add new data sources. I’ve learned how to do this firsthand, and thought it’d be helpful to share my experience getting started. Last October, I joined Elastic Security when Elastic and Endgame combined forces. Working with our awesome security community, I’ve had the opportunity to add new data sources for our users to complement our growing catalog of integrations.
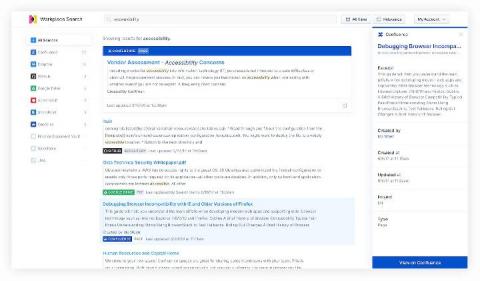
Searching Confluence with Elastic Workplace Search
For many companies, Elastic included, wikis developed with Confluence are a critical source of content, procedures, policies, and plenty of other important info, spanning teams across the entire organization. But sometimes finding a particular nugget of information can be tricky, especially when you’re not exactly sure where that information was located. Was it in the wiki? In a Word doc? In Salesforce? A GitHub issue? Somewhere else?


