Operations | Monitoring | ITSM | DevOps | Cloud

Latest Posts

Shipping Multiline Logs with Filebeat

Multiline logs provide valuable information for developers when troubleshooting issues with applications. An example of this is the stack trace. A stack trace is a sequence of method calls that an application was in the middle of when an exception was thrown. The stack trace includes the line in question that encountered the error, as well as the error itself.

You've launched your first Kubernetes cluster, now what?

As Kubernetes continues to grow in popularity at a staggering rate, it’s only natural more and more people want to see what all the fuss is about. We’ve seen first hand how excited people are to try it out since launching #KUBE100 (our Kubernetes beta) – we’ve had tremendous interest and some great feedback so far. If you’re reading this and you have no idea what #KUBE100 is, it’s the name we gave to our k3s-powered, managed Kubernetes beta program.

Complete Winston Logger Guide With Hands-on Examples

Logging is critical for monitoring and troubleshooting your Node.js project. The open-source Winston logger helps take a load off our shoulders by making it easier to centralize, format, enrich, and distribute the logs to fit a particular need. Winston creates custom logger instances which can be configured to act as centralized logging entities. Essentially, the internal architecture of the module decouples the actual event logging from the implementation of the storage logic.

How to use JFrog CLI to Create, Update, Distribute & Delete Release Bundles

This blog post will provide you with information on how to use JFrog CLI with JFrog Distribution workflows. JFrog Distribution manages your software releases in a centralized platform. It enables you to securely distribute release bundles to multiple remote locations and update them as new release versions are produced. For those of you who are not yet familiar with the JFrog CLI, it is an easy to use client that simplifies working with JFrog solutions using a simple interface.

Summary of Icinga Virtual Meetup 2020/04

Last week we finally had our first virtual Icinga Meetup. Since we had some trouble at our very first try, we were even more excited and nervous about this. This time, after a couple of minutes it was clear that everything will go well from the technical perspective. We were prepared content-wise as well and almost all of the registered attendees showed up. Experiencing the first couple of minutes going so well was a huge relief and, in the end, the whole meeting was a great event.

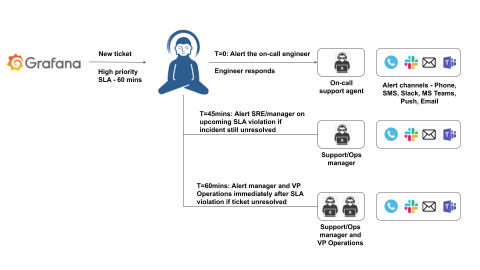
Grafana alerts and incident escalation with Zenduty

Grafana is one of the most popular open-source visualization tools that can be used on top of a variety of different data stores but is most commonly used together with Graphite, InfluxDB, Prometheus, Elasticsearch, Prometheus, AWS CloudWatch, and many others. Reliability engineers use Grafana is its ability to bring together several data sources together in a unified dashboard and increase the observability of your production systems.

Monitoring Amazon EKS logs and metrics with the Elastic Stack

To achieve unified observability, we need to gather all of the logs, metrics, and application traces from an environment. Storing them in a single datastore drastically increases our visibility, allowing us to monitor other distributed environments as well. In this blog, we will walk through one way to set up observability of your Kubernetes environment using the Elastic Stack — giving your team insight into the metrics and performance of your deployment.

MITRE ATT&CK® round 2 APT emulation validates Elastic's ability to eliminate blind spots

Six months ago we celebrated the joining of forces between Endgame and Elastic under the banner of Elastic Security and announced the elimination of per endpoint pricing. Simultaneously, while the newest members of Elastic Security were getting acquainted with the Elastic SIEM team, a few of our analysts were locked away in an office at MITRE HQ for round 2 of MITRE’s APT emulation.

Should I Stay or Should I Go? A cloudy decision

If you’ve been operating in the cloud for some time now, chances are your business has changed since you first made that move. Has your cloud usage grown considerably—and your OpEx costs? Is that just the cost of doing business in the cloud? It doesn’t have to be. Here’s how you can rationalize your infrastructure and determine if there are cloud expenses you can reclaim and even if it makes sense to move some of your cloud deployments into co-location.