Operations | Monitoring | ITSM | DevOps | Cloud

Latest Posts

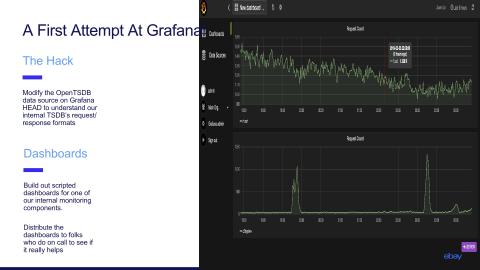
How eBay Moved from Custom UIs to Grafana Plugins

In the beginning, the mission of the logging and monitoring team at eBay was simple: “to give out APIs that the developers in the company could use to instrument their applications [in order] to send logs,” Vijay Samuel said during his talk at GrafanaCon about eBay’s journey to using Grafana plugins. “We had our own developers who built out UIs for being able to search view and debug their issues. And metrics were no different from logs.

Kafka Metrics to Monitor

As the first part of a three-part series on Apache Kafka monitoring, this article explores which Kafka metrics are important to monitor and why. When monitoring Kafka, it’s important to also monitor ZooKeeper as Kafka depends on it. The second part will cover Kafka open source monitoring tools, and identify the tools and techniques you need to further help monitor and administer Kafka in production.

Kafka Open Source Monitoring Tools

Open source software adoption continues to grow within enterprises (even for legacy applications), beyond just startups and born-in-the-cloud software. In this second part of our Kafka monitoring series (see the first part discussing Kafka metrics to monitor), we’ll take a look at some open source tools available to monitor Kafka clusters. We’ll explore what it takes to install, configure, and actually use each tool in a meaningful way.

Monitoring Kafka with Sematext

Monitoring Kafka is a tricky task. As you can see in the first chapter, Kafka Key Metrics to Monitor, the setup, tuning, and operations of Kafka require deep insights into performance metrics such as consumer lag, I/O utilization, garbage collection and many more. Sematext provides an excellent alternative to other Kafka monitoring tools because it’s quick and simple to use.

The top 10 reasons companies are choosing Opsgenie over competitors

Over the last six months, Opsgenie’s customer base has expanded significantly. We’ve become the tool of choice for teams that are new to operating always-on services, as well as those who have been left disappointed by alternative solutions. We can claim many advantages over our competition, but here are the top ten reasons Dev and Ops teams are choosing Opsgenie.

Searching for Actionable Signals: A Closer Look at Time Series Data Anomaly Detection

Simple enough to be embedded in text as a sparkline, but able to speak volumes about your business, time series data is the basic input of Anodot’s automated anomaly detection system. This article begins our three-part series in which we take a closer look at the specific techniques Anodot uses to extract insights from your data.

Linux Security Guide: How to Investigate Suspected Break-in Attempts in Linux

Scenario Linux has a number of built-in tools, commands and files which can track and store information about every user activity. These tools are common in most Linux distributions and can be used to investigate suspicious logins or failed login attempts into the system. In this article, we will talk about some of the initial methods to identify possible security breaches. We will use an Amazon EC2 instance to show these commands.