Operations | Monitoring | ITSM | DevOps | Cloud

Latest Posts

Exploring The Business Applications Of Virtual Reality With Consultants

Virtual reality technology is not limited to just gaming and entertainment industries as it was in the past. Today, it is reshaping how companies behave, providing new opportunities to communicate with consumers and improve their performance. From buying a house to treating patients, industries are realizing the value of incorporating VR into operations.

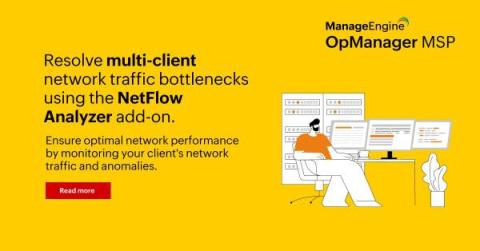
Address multi-client network traffic monitoring challenges with OpManager MSP's new NetFlow Analyzer integration

OpManager MSP has a new standout integration with NetFlow Analyzer. What does this integration mean for MSPs with bandwidth monitoring management? Network monitoring solutions are indispensable for MSPs as they enable proactive issue detection, enhance security, improve reliability and uptime, ensure scalability, and optimize cost efficiency for both MSPs and their clients.

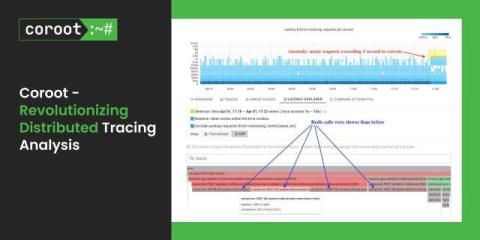
Coroot v1.0: Revolutionizing Distributed Tracing Analysis

We’re excited to announce Coroot v1.0 – our first stable version. It includes some great improvements, such as a new Distributed Tracing interface that takes troubleshooting to the next level. In this post, we’ll compare existing open-source distributed tracing tools, identify unsolved problems in the troubleshooting process, and see how Coroot can address them with its brand-new distributed tracing feature. These days, software is getting more complicated.

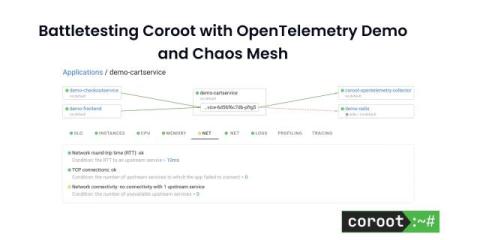
Battletesting Coroot with OpenTelemetry Demo and Chaos Mesh

The most effective method for evaluating an observability tool is to introduce a failure intentionally into a fairly complex system, and then observe how quickly the tool detects the root cause. We’ve built Coroot based on the belief that having high-quality telemetry data enables us to automatically pinpoint the root causes for over 80% of outages with precision. But you don’t have to take our word for it—put it to the test yourself!

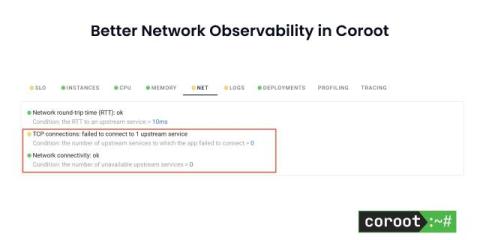
Better Network observability in Coroot

One service can’t connect to another (or can’t establish a database connection) – underneath this simple definition, there can be two very different conditions. First – we may have a service process down. In this case, the Kernel stack is operational, so we are getting the packet back, indicating the connection was refused. Second – when network flow is completely disrupted due to connectivity issues, firewall, or a node being completely down.

Website Monitoring for Startups: Essential Strategies for Early Stage Growth

For startups, every interaction counts, and first impressions matter. So, website monitoring should be an integral part of any startup’s digital strategy. Ensuring your site is fast, available, and secure not only enhances user experience but also solidifies your reputation as a reliable and professional business. It’s not just about keeping your site online; it’s about offering a seamless, engaging user experience that can significantly influence your startup’s growth and success.

How To Visualize Business Service Performance with Splunk ITSI

The complex nature of modern digital landscapes means the ability to effectively monitor and understand its impact on your business is not just desirable — it's a necessity. This is where Splunk IT Service Intelligence (ITSI) comes into play. ITSI offers a sophisticated platform for service insights and detailed analytics that can be used by digital operations teams as the first step of a troubleshooting workflow.

What's New in Rightsizing in VMware Tanzu CloudHealth

In March of 2024, The FinOps Foundation announced an update to the FinOps Framework. Within that Framework, each domain is meant to describe a set of business outcomes that a mature FinOps practice should ultimately strive for. As an individual customer’s cloud usage grows and as they progress through their own cloud journey, they will end up working through their challenges in each of these domains. However, each customer’s cloud journey is rarely linear, and maturing is never easy.