Operations | Monitoring | ITSM | DevOps | Cloud

Latest Posts

'The Story of Grafana' documentary: From one developer's dream to 20 million users worldwide

On Dec. 5, 2013, Torkel Ödegaard made the first commit in GitHub for a personal project that would become Grafana. “It’s hard to believe it’s been 10 years since Torkel launched Grafana, growing from a small man with a big dream to becoming the most popular data visualization software in the world,” says Grafana Labs co-founder and CEO Raj Dutt. “The Story of Grafana” chronicles that meteoric journey.

Maximize branding with custom HTML in status pages

Imagine checking a status page during a service disruption only to be greeted by a generic and impersonal display, devoid of any brand identity or relevant information. A status page without customization feels detached and fails to provide a good digital user experience. In addition, a status page that doesn't match your brand's look and feel can make the communication seem mundane.

Aggregate Data in Cribl Stream to Optimize Your SIEM Data and Its Performance

Cribl Stream offers different ways to optimize data, such as: In this blog, I will focus on the Aggregation use case using the Aggregations function and how you can practically use the Aggregations function to format the output in different ways.

Dramatic AWS Savings Strategies From Successful Brands

Amazon Web Services (AWS) has emerged as the leader in cloud computing. As the dominant cloud service provider, AWS offers a vast array of solutions encompassing computing power, storage options, and networking capabilities to businesses across the globe. Its popularity stems not only from its comprehensive services, but also from its scalability, allowing businesses of all sizes to expand their cloud footprint without unprecedented ease and flexibility.

How to Build Dashboards

Reporting and analytics dashboards provide enhanced visibility into your data and the ability to view your most critical metrics via a single source of truth. By using dashboards, your team can easily highlight issues or areas of concern and promptly begin addressing them utilizing the real-time data that a dashboard provides. As well as this they can be utilized to drive data-driven decisions for your organization, enabling greater accuracy for decision-making to drive growth.

Resource Constraints in Kubernetes and Security

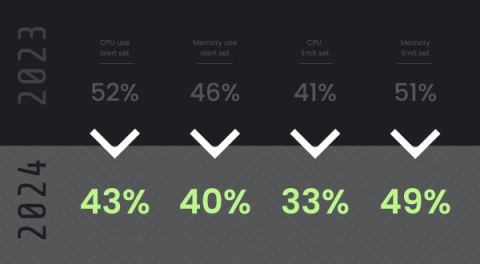
The Sysdig 2024 Cloud‑Native Security and Usage Report highlights the evolving threat landscape, but more importantly, as the adoption of cloud-native technologies such as container and Kubernetes continue to increase, not all organizations are following best practices. This is ultimately handing attackers an advantage when it comes to exploiting containers for resource utilization in operations such as Kubernetes.