Operations | Monitoring | ITSM | DevOps | Cloud

Latest News

Rate Limiting with the HAProxy Kubernetes Ingress Controller

Add IP-by-IP rate limiting to the HAProxy Kubernetes Ingress Controller. DDoS (distributed denial of service) events occur when an attacker or group of attackers flood your application or API with disruptive traffic, hoping to exhaust its resources and prevent it from functioning properly. Bots and scrapers, too, can misbehave, making far more requests than is reasonable.

Painting a Complete Network Monitoring Picture: Why Context is Critical

In order to produce their masterpieces, artists like van Gough, Rembrandt, Picasso, and Monet painted with more than just one color. Being able to choose from multiple colors (not to mention an abundance of talent, inspiration, and creativity) is what allowed these artists to see their complete vision come to life on canvas. However, if you’re relying on a single set of data to troubleshoot network issues, it’s like you’re stuck painting with one color.

What Is a Traffic Analysis Attack?

The times when it was enough to install an antivirus to protect yourself from hackers are long gone. We actually don’t hear much about viruses anymore. However, nowadays, there are many different, more internet-based threats. And unfortunately, you don’t need to be a million-dollar company to become a target of an attack. Hackers these days use automated scanners that search for vulnerable machines all over the internet. One such modern threat is a traffic analysis attack.

The 95th Percentile: How to Manage Capacity Before You Run Out

One of the largest challenges with network bandwidth metering is the way traffic flows. Traffic comes in bursts. It’s never a constant, predictable stream of data you can measure once, spec hardware for and be done with (wouldn’t that be nice?!). Instead, you need to account for the dynamic nature of bandwidth utilization and its impact on performance. You’ll never be able to predict every burst of traffic your network experiences.

Monitoring Load Balancers with Grafana

Load balancers play an important role in distributed computing. With load balancers, you can distribute heavy work loads across multiple resources, which allows you to scale horizontally. Since they are placed prior to computing resources, they need to endure heavy traffic and allocate it to the right resources fast. For this to happen, monitoring the health and performance of load balancers is key. In monitoring, visualization helps users to view various metrics quickly.

Monitoring Network Switches with Grafana

In monitoring, a target system or device is a deciding factor in designing your monitoring stack. You will have to consider various aspects starting from how you want to collect data in what frequency to how you want to surface metrics to end users. You will have to take this strategic approach when you want to monitor your network infrastructure. In this article, we will discuss how Grafana, an open-source visualization tool, can help you to monitor network switches.

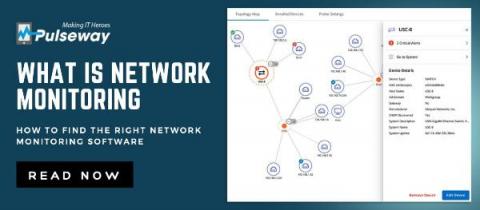
What Is Network Monitoring?

Network monitoring is the practice of making sure the network as a whole, functions optimally by keeping a watch over all endpoints of a network, which is the heart of any business’s routine functioning. Any discrepancy in the form of a breach or slowdown could prove costly. Proactively monitoring networks helps administrators identify and prevent any potential issues that could occur at any time.

How NaaS Can Support Development and Testing Environments

The widespread adoption of the cloud has transformed the way applications are developed just as much as it has transformed the way they are deployed and consumed. In this blog we look at how Network-as-a-Service (NaaS) can help developers support the complete application lifecycle by unlocking the value of PaaS (Platform-as-a-Service).

Root cause analysis using Metric Correlations

As complexity of systems and applications continue to evolve and change, the number of metrics that need to be monitored grows in parallel. Whether you’re on a DevOps team, an SRE, or a developer building the code yourself, many of these components may be fragmented across your infrastructure, making it increasingly difficult to identify the root cause when experiencing downtime or abnormal behavior.