Operations | Monitoring | ITSM | DevOps | Cloud
Latest News
Deploying Highly Available K3s with External Database
Having trouble deploying Kubernetes in a highly available mode and have a backing remote database? This blog is for you. I will explain how to deploy K3s in HA configuration with an external database Postgres. K3s is a certified Kubernetes distribution for IoT and Edge computing. I deployed it on virtual machines in an IBM Z mainframe. Instead of etcd, I choose Postgres as my storage for my K3s clusters. I deployed Postgres in non HA mode.
Redgate Software Adopts Policy-Driven Approach to Data Protection with New Data Catalog Release
Scaling Grafana Mimir to 500 million active series on customer infrastructure with Grafana Enterprise Metrics
At Grafana Labs, we’ve seen an increasing number of customers who are scraping hundreds of millions of active time series but need a solution to reliably store and query such a huge amount of data. So in March, we announced our new open source TSDB, Grafana Mimir, the most scalable, most performant open source time series database in the world.
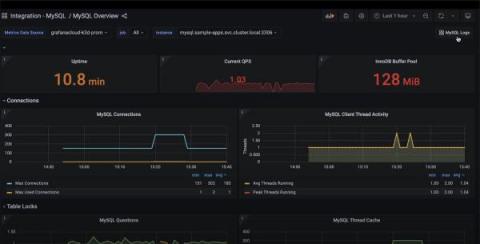
Collect and visualize MySQL server logs with the updated MySQL integration for Grafana Cloud
Today, we are excited to announce that the MySQL integration has received an important update, which includes a new pre-built MySQL logs dashboard and the Grafana Agent configuration to view and collect MySQL server logs. The integration is already available in Grafana Cloud, our platform that brings together all your metrics, logs, and traces with Grafana for full-stack observability.
How to monitor MongoDB with OpenTelemetry
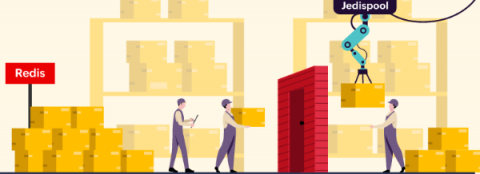
How to optimize Redis with JedisPool
Do you love reading about how various performance-related issues are traced out and fixed? If so, here's our story of how we fixed the Redis performance issues we were facing by optimizing JedisPool. We hope this will help you strengthen your IT environment. Our Redis performance issues and efforts to find the cause
DevOps 101: How to kick-start your DevOps initiative
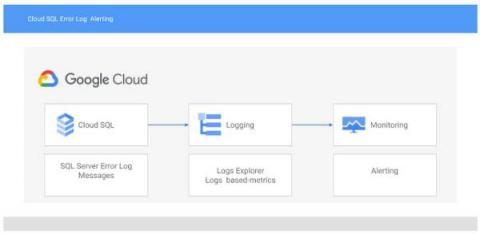
Alerting on error log messages in Cloud SQL for SQL Server
With Cloud SQL for SQL Server, you can bring your existing SQL Server on-premises workloads to Google Cloud. Cloud SQL takes care of infrastructure, maintenance, and patching so you can focus on your application and users. A great way to take better care of your application is by monitoring the SQL Server error log for issues that may be affecting your users such as deadlocks, job failures, and changes in database health.
How to Choose a Scalable Open Source Time Series Database: The Cost of Scale
When looking for a highly scalable time series database, there are a number of criteria to investigate and evaluate. First up, it’s always a good idea to consider open source software. It’s more likely to have gone through comprehensive troubleshooting, it’s typically more reliable as it has more timely and widespread peer-review, it better guarantees technology independence, it’s easier to find engineers who are familiar with it and it has great security.


