Operations | Monitoring | ITSM | DevOps | Cloud
Latest News
Top 8 Database Version Control Tools
Many DevOps teams struggle to achieve consistent builds and releases due to ineffective collaboration and communication strategies. Over 71% of software teams today are working remotely from global locations, according to a survey by Perforce and DevOps.com. Interestingly, this consistency challenge can be easily solved by a simple approach – database version control.
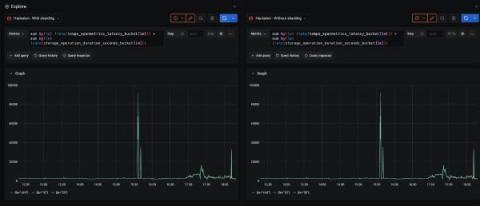
How we improved Grafana Mimir query performance by up to 10x
Earlier this year we introduced the world to Grafana Mimir, a highly scalable open source time series database for Prometheus. One of Mimir’s guarantees is 100% compatibility with PromQL, which it achieves by reusing the Prometheus PromQL engine. However, the execution of a query in the Prometheus PromQL engine is only performed in a single thread, so no matter how many CPU cores you throw at it, it will only ever use one core to run a single query.
New Features and Enhancements in SQL Server 2022
DevOps Best Practices for Database
DevOps has been bridging the gap between the development and operations teams for more than a decade. It is eliminating the organizational barriers between the two and automates the delivery process. It's time to start treating databases the same way we treat the delivery pipeline when applying DevOps. When we have a large database, automation is crucial. When the database has too much information, changing a table can take ages and block further changes like inserts, updates, or deletes.
How to monitor Cassandra using OpenTelemetry
Tracing Gorm queries with OpenCensus & Google Cloud Tracing
At incident.io we use gorm.io as the ORM library for our Postgres database, it’s a really powerful tool and one I’m very glad for after years of working with hand-rolled SQL in Go & Postgres apps. You may have seen from our other blog posts that we’re heavily invested in tracing, specifically with Google Cloud Tracing via OpenCensus libraries.
Introducing VMware Tanzu GemFire for Redis Apps
The release of VMware Tanzu GemFire 9.15 introduces compatibility with the VMware Tanzu GemFire for Redis Apps add-on. This add-on enables compatibility between Redis applications and Tanzu GemFire for the first time ever, unlocking enterprise-ready features for your Redis applications.
PostgreSQL Logging Configuration Explained: How to Enable Database Logs
PostgreSQL is an open-source relational database management system that’s been utilized in continuous development and production for 30 years now. Nearly all the big tech companies use PostgreSQL, as it is one of the most reliable, battle-tested relational database systems today. PostgreSQL is a critical point in your infrastructure, as it stores all of your data. This makes visibility mandatory, which in turn means you have to understand how logging works in PostgreSQL.
Analyze wait events and in-flight queries with the Datadog Database List
When you’re operating databases at scale, being able to get real-time insights across all your databases is essential for addressing issues and identifying areas for optimization. Datadog Database Monitoring’s Database List allows you to monitor your entire database fleet in one place, so you can quickly identify and troubleshoot overloaded hosts and gauge the impact of problematic queries throughout your infrastructure.


