Operations | Monitoring | ITSM | DevOps | Cloud
Latest News
Performance tuning with SQL Monitor: tempdb usage, parameter sniffing, and blocking chains
Redgate embraces open source with its ongoing development of Flyway
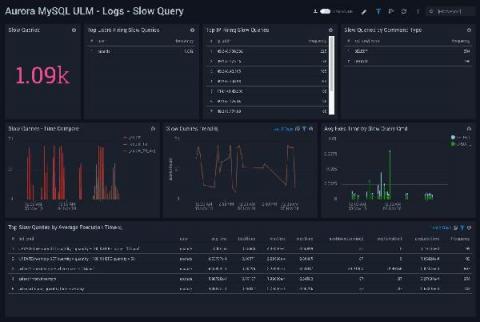
How to monitor Amazon Aurora RDS logs and metrics
How to monitor an Oracle database with Prometheus
In this article, we will explain how to monitor an Oracle Database with Prometheus using an exporter to generate metrics. Also, we will review the main metrics that you should monitor on resource usage and performance, and what to alert on to detect issues and incidents in your Oracle Database.
Flyway's Growth Demonstrates the Value of Open Source for Software Companies
Monitoring Oracle Database
GroundWork Monitor makes it simple to monitor the health of Oracle databases, whether the need is simple monitoring of availability or for capacity planning purposes. Oracle databases may be monitored either directly on the Oracle host or from a different host, using the GroundWork Distributed Monitoring Agent (GDMA). In both scenarios, SQL queries are used to provide the data from the database.
Tuning MySQL and the Ghost of Index Merge Intersection
Optimizing SQL queries is always fun—except when it isn’t. If you’re a MySQL veteran and have read the title, you already know where this is heading 😉. In that case, allow me to regale the uninitiated reader. This is the story of an (apparently) smart optimization to a SQL query that backfired spectacularly—and how we finally fixed it. It started off with a customer noticing that a SQL query was running slowly in their environment.
Support for Database Performance Monitoring in Node
Performance monitoring is great because it lets you see whether your application is fast or slow, and which parts need speeding up. For Node developers, those “parts” are most often endpoints handling incoming requests. Since the introduction of our performance monitoring offering in July 2020, Node devs have been able to use the Sentry SDK, @sentry/node, to measure the total time it takes to process each request, but we made some significant improvements since then.


