Operations | Monitoring | ITSM | DevOps | Cloud

Latest News

Implementing OpenTelemetry in Spring Boot - A Practical Guide

OpenTelemetry can auto-instrument your Java Spring Boot application to capture telemetry data from a number of popular libraries and frameworks that your application might be using. It can be used to collect logs, metrics, and traces from your Spring Boot application. In this tutorial, we will integrate OpenTelemetry with a Spring Boot application for traces and logs. Before the demo begins, let's have a brief overview of OpenTelemetry.

How To Identify Requests as Part of an End-To-End Tracing Strategy

Tracing follows requests as they move through an entire network, from the initial client request to the final response. In financial services, end-to-end tracing is essential for maintaining robust security, ensuring comprehensive observability of system operations, and understanding chains of events in case of issues or anomalies.

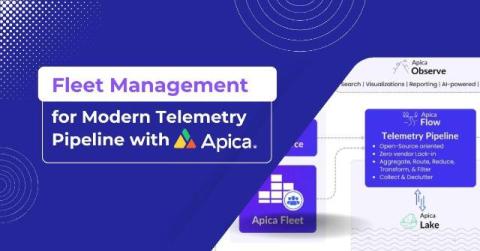
What is Fleet Management in Telemetry?

Fleet management is a derivative term. Originally used in the automotive industry, it’s now used in a span of domains. It’s being used in data telemetry since the introduction of OpAmp, which is a part of the Open Telemetry project. Now, fleet management has broader implications. It simplifies telemetry data collection by automating agent deployment, and configuration, and providing insights into the real-time health and performance of your sprawling agent infrastructure.

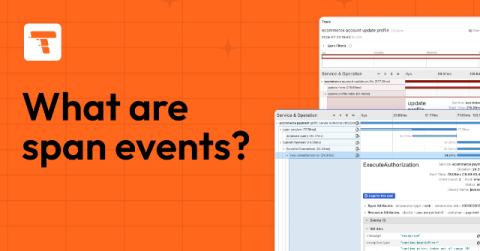
All about span events: what they are and how to query them

If you’re already familiar with distributed tracing, you know that spans are the building blocks of traces. But are you sleeping on what span events can do for you? First, you may need a wake-up call as to what a span event even is. While spans represent units of work or operation within a trace, a span event is a unique point in time during the span’s duration.

OpenTelemetry vs. OpenTracing - Decoding the Future of Telemetry Data

OpenTelemetry and OpenTracing are open-source projects used to instrument application code for generating telemetry data. While OpenTelemetry can help you generate logs, metrics, and traces, OpenTracing focuses on generating traces for distributed applications. If you’re thinking of choosing between OpenTelemetry and OpenTracing, go for OpenTelemetry. OpenTracing is now deprecated, and users of OpenTracing are advised to migrate to OpenTelemetry.

OpenTelemetry vs Datadog - Choosing the Right Monitoring Tool

OpenTelemetry and DataDog are both used for monitoring applications. While OpenTelemetry is an open source observability framework, DataDog is a cloud-monitoring SaaS service. OpenTelemetry is a collection of tools, APIs, and SDKs that help generate and collect telemetry data (logs, metrics, and traces). OpenTelemetry does not provide a storage and visualization layer, while DataDog does.

Jaeger vs. Grafana Tempo: A Comprehensive Comparison for Distributed Tracing

When it comes to monitoring, diagnosing, and optimizing the performance of complex systems today, you can’t really go wrong with tracing tools. And while OpenTelemetry has become the go-to choice for instrumenting apps and collecting traces, there are several other options in the backend that can effectively store, manage, and analyze traces sent by OpenTelemetry. Two of these open-source tools are Jaeger and Grafana Tempo. In this article, we’ll compare and contrast the two.