Operations | Monitoring | ITSM | DevOps | Cloud

Latest News

How to Monitor JVM with OpenTelemetry

The Java Virtual Machine (JVM) is an important part of the Java programming language, allowing applications to run on any device with the JVM, regardless of the hardware and operating system. It interprets Java bytecode and manages memory, garbage collection, and performance optimization to ensure smooth execution and scalability. Effective JVM monitoring is critical for performance and stability. This is where OpenTelemetry comes into play.

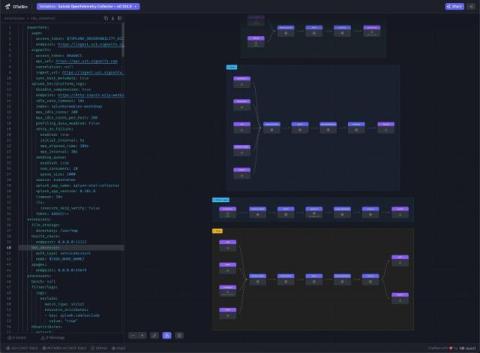
Setting up and Understanding OpenTelemetry Collector Pipelines Through Visualization

Observability provides many business benefits, but comes with costs as well. Once the (not-insignificant) work of picking a platform, taking an inventory of your applications and infrastructure, and getting buyin from leadership (both from the business and engineering sides of the house) is done, you then have to actually instrument your applications to emit data, and build the data pipeline that sends that data to your observability system.

OpenTelemetry Is The Strategic Choice

OpenTelemetry (OTel) should be at the heart of your observability strategy. There is no longer a need to pay for the collection of telemetry data; instead, use the unified OTel standard for all your telemetry data. Once you have the data in a standard form, you can choose where to process it, either on your own servers or via one of many SaaS providers.

How to Ship AWS Cloudwatch Logs to Any Destination with OpenTelemetry

Observability and log management are needed for a strong IT strategy. Two essential tools for these purposes are AWS CloudWatch and OpenTelemetry. AWS Cloudwatch provides real-time data and insights into AWS-powered applications' health, performance, and efficiency. On the other hand, OpenTelemetry is an open-source observability framework that assists developers in creating, gathering, and exporting telemetry data (such as traces, metrics, and logs) for analysis.

Towards Jaeger v2 Moar OpenTelemetry!

Jaeger, the popular open-source distributed tracing system, is getting a major upgrade with the upcoming release of Jaeger v2. This new version is a new architecture for Jaeger backend components that utilizes OpenTelemetry Collector framework as the base and extends it with Jaeger’s unique features. It promises to bring significant improvements and changes, making Jaeger more flexible, extensible, and even better aligned with the OpenTelemetry project.

Streamlining Debugging with Lightrun Snapshots: A Superior Alternative to Trace Logging

According to a recent study, failing tests alone cost the enterprise software market an astonishing $61 billion annually. This figure mirrors the vast number of resources devoted to rectifying software failures, translating into about 620 million developer hours lost each year. On average, engineers spend 13 hours to resolve a single software failure, a statistic that paints a stark picture of the current state of debugging efficiency.

How to Build a Custom OpenTelemetry Collector

Telemetry data collection and analysis are important for businesses. We're diving right in to explain the ins and outs of the OpenTelemetry Collector, including its core components, distribution selection, and customization tips for optimal data collection and integration. Whether you're new to OpenTelemetry or expanding your capabilities, this will help you effectively use the OpenTelemetry Collector in your observability strategy.

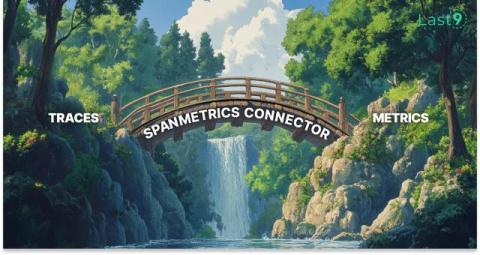
Convert OpenTelemetry Traces to Metrics using SpanMetrics Connector

What if your have already implemented tracing but lacks robust metrics capabilities? Enter SpanConnector: a tool that bridges this gap by converting trace data into actionable metrics. This post details the workings of SpanConnector, providing a guide on its configuration and implementation.