Operations | Monitoring | ITSM | DevOps | Cloud

Latest News

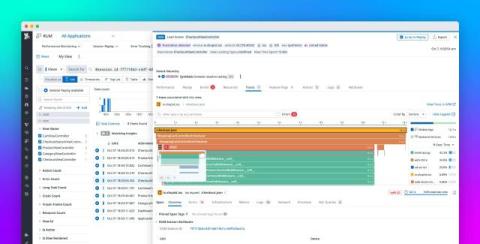
Trace your applications end to end with Datadog and OpenTelemetry

As teams adopt OpenTelemetry (OTel) to instrument their systems in a vendor-neutral way, they often face a challenge in effectively tracing activity throughout their entire stack, from frontend user interactions to backend services and databases. While OTel enables basic tracing, teams still need a way to access advanced capabilities like continuous profiling to adequately optimize performance and troubleshoot issues in their applications.

Understanding Jaeger - From Basics to Advanced Distributed Tracing

Jaeger has emerged as a crucial tool in the modern distributed systems landscape, offering powerful tracing capabilities that help organizations understand and optimize their microservices architectures. This comprehensive guide explores everything from basic concepts to advanced implementations, providing you with the knowledge needed to effectively implement and utilize Jaeger in your environment.

AWS X-Ray vs Jaeger - Choosing the Right Distributed Tracing Tool

Distributed tracing has become an essential part of any application's performance monitoring strategy. As businesses adopt distributed architectures, choosing the right tracing tool is crucial for efficient troubleshooting and performance monitoring. The two most prominent choices are AWS X-Ray and Jaeger, each offering unique features and advantages. AWS X-Ray, a managed service by Amazon, simplifies tracing for applications running on AWS.

Reduce Observability Costs with OpenTelemetry Setup

Maintaining and visualizing telemetry data efficiently is super important for DevOps and SecOps teams. OpenTelemetry, a fantastic open-source observability framework, can really help with this without being too costly. Picture having a simple process that improves your data and helps your team make smart decisions without spending too much money. Let's chat about some budget-friendly ways to set up OpenTelemetry agents.

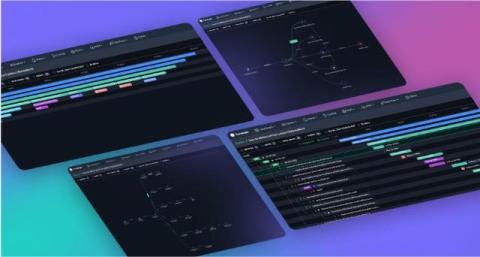
Master debugging with four ways to visualize your traces

In a world where microservices rule and distributed architectures are the norm, understanding how a single request flows through your system can be an overwhelming challenge. But don’t worry—there’s light at the end of the tunnel! And not just one light, but four.

OpenTelemetry Tips Every DevOps Engineer Should Know

OpenTelemetry has quickly become a must-have tool in the DevOps toolkit. It helps us understand how our applications are performing and how our systems are behaving. As more and more organizations move to cloud-native architectures and microservices, it's super important to have great monitoring and tracing in place. OpenTelemetry provides a strong and flexible framework for capturing data that helps DevOps engineers keep our systems running smoothly and efficiently.

Using Trace Data for Effective Root Cause Analysis

Solving system failures and performance issues can be like solving a tough puzzle for engineers. But trace data can make it simpler. It helps engineers see how systems behave, find problems, and understand what's causing them. So let’s chat about why trace data is important, how it's used for finding the root cause of issues, and how it can help engineers troubleshoot more effectively.

Getting Started with OpenTelemetry Visualization - A Practical Guide

OpenTelemetry is a Cloud Native Computing Foundation(CNCF) project aimed at standardizing the way we instrument applications for generating telemetry data(logs, metrics, and traces). However, OpenTelemetry does not provide storage and visualization for the collected telemetry data. For OpenTelemetry visualization, you need to use a backend that can ingest the collected data and provide a web UI to visualize it.