Operations | Monitoring | ITSM | DevOps | Cloud

Latest News

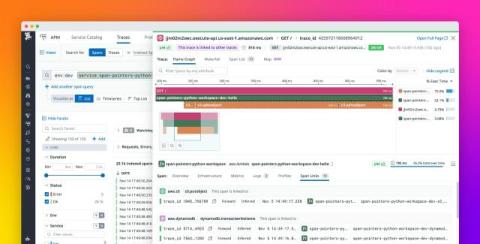
Get deeper visibility into your AWS serverless apps with enhanced distributed tracing

Serverless or event-driven applications can comprise many different distributed components, including serverless compute services such as AWS Lambda and AWS Fargate for Amazon ECS, as well as managed data streams, data stores, workflow orchestration tools, queues, and more. Having full end-to-end visibility into requests as they propagate across all of these parts of your application is crucial to monitoring performance, locating affected up- or downstream services, and troubleshooting issues.

Collecting Windows telemetry with Elastic: An introduction to the ETW Filebeat input

In the world of security, being able to use system telemetry of Windows hosts opens new possibilities for monitoring, troubleshooting, and securing IT environments. Recognizing this, Elastic has introduced new capabilities focused on Event Tracing for Windows (ETW) — a powerful Windows-native mechanism for capturing a vast array of system and application events. With these new additions, Elastic users can capture, analyze, and visualize Windows telemetry using the Elastic Search AI Platform.

Mastering Tail Sampling for OpenTelemetry: Cost-Effective Strategies with Cribl

Recently, I have seen a trend of enterprises moving toward OpenTelemetry (OTel) for application tracing. Tail sampling, in particular, has emerged as a preferred approach to gain actionable insights while balancing data volume and cost. OpenTelemetry offers developers and practitioners the ability to instrument their code with open-source tools, moving away from vendor-provided tools for application instrumentation.

OpenTelemetry vs OpenTracing - Key Differences and Migration Path

OpenTelemetry and OpenTracing are two closely connected open-source projects that enhance observability in modern distributed systems. They are designed to instrument application code for generating telemetry data. OpenTelemetry is a comprehensive, vendor-neutral framework that helps capture various types of telemetry data, while OpenTracing focuses specifically on tracing and provides a way to instrument applications for that purpose.

Prometheus 3.0 and OpenTelemetry: a practical guide to storing and querying OTel data

Over the past year, a lot of work has gone into making Prometheus work better with OpenTelemetry—a move that reflects the growing number of engineers and developers that rely on both open source projects. Historically, Prometheus users have faced a number of challenges when trying to work with OpenTelemetry (and vice versa).

Tracing the Line: Understanding Logs vs. Traces

In the software space, we spend a lot of time defining the terminology that describes our roles, implementations, and ways of working. These terms help us share fundamental concepts that improve our software and let us better manage our software solutions. To optimize your software solutions and help you implement system observability, this blog post will share the key differences between logs vs traces.

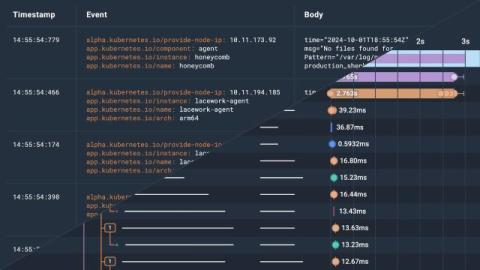
Relational Fields: Query Even More Relationships in Your Traces

Earlier this year, we introduced relational fields. Relational fields enable you to query spans based on their relationship to one other within a trace, rather than only in isolation. We’ve now expanded this feature and introduced four new prefixes: child., none., any2., and any3.. Previously, you could use root., parent., and any. to query on the root span of your target span’s trace, the parent span of your target span, and any other span in the same trace as your target span.