Operations | Monitoring | ITSM | DevOps | Cloud

Latest News

Introducing, Dashbird Atlas

We’re pleased and honored to be part of the Serverless revolution - continuously innovating to make processes and day-to-day tasks for serverless users more efficient, seamless and enjoyable. So let’s get right into the new and exciting stuff now! Earlier this year, Dashbird launched the very well-received Insights Engine designed to encourage a proactive approach when building and operating serverless applications.

The No Sweat Guide to Effective Switch Management

An on-site switch plays a critical role in a network: that of connecting your users to the rest of the IT infrastructure. Don’t think of that jack in the wall or under the cubicle as a simple Ethernet port. As part of effective switch management, you need to think of it as the mission-critical gateway to IT services that it is.

Website Monitoring with SIGNL4

SIGNL4’s core job is to reliably alert operational teams. However, we’ve been asked a couple of times if SIGNL4 can also monitor a website’s uptime. Well, we developed an app and it is now available in the SIGNL4 app gallery. You can now monitor the availability of websites AND get instantly alerted if is goes down. This can be set up in minutes. The new SIGNL4 app “Website Monitoring” checks the availability of a website and queries its URL in configurable intervals.

A conversation about Grafana Labs' new partnership with New Relic

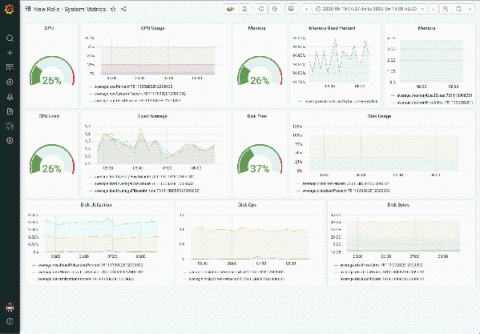
In helping users unify and contextualize all their observability data, Grafana is completely database-agnostic. “We believe that organizations get the best view of what’s going on when they pull in their data from wherever it lives,” said Raj Dutt, CEO of Grafana Labs, the company behind Grafana.

Netdata Agent v1.24: Prometheus/OpenMetrics collector and multi-host database mode

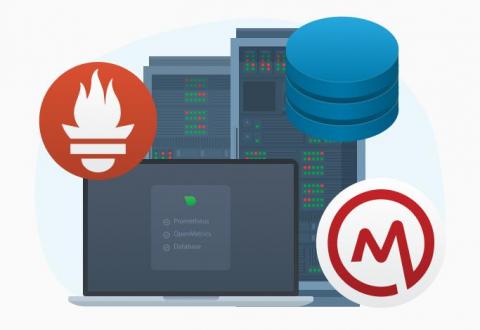
This release broadens our commitment to open standards, interoperability, and extensibility with a new generic Prometheus collector that works seamlessly with any application that makes its metrics available in the Prometheus/OpenMetrics exposition format, including support for Windows 10 via windows_exporter. Netdata will autodetect over 600 Prometheus endpoints and instantly generate charts with all the exposed metrics, meaningfully visualized.

Performing Zabbix Alert Correlation and Incident Acceleration with CloudFabrix AIOps

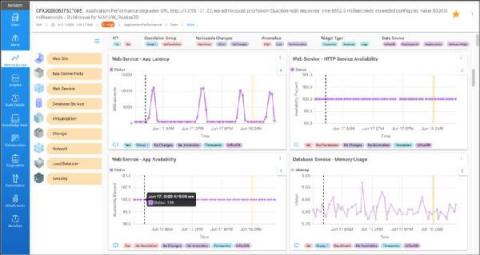
CloudFabrix AIOps 360 solution can ingest alerts, events, metrics and from various monitoring tools to perform event correlation, alert noise reduction and enable incident resolution acceleration. Learn more about CloudFabrix AIOps 360 In this blog I will cover Zabbix integration aspects with our AIOps 360 solution. Zabbix is one of the popular open source monitoring platforms used by many enterprises and MSPs, including some of our customers.

What Can Pandora FMS Offer as a Server Monitoring Tool?

When your server goes down, it can certainly throw a wrench into your daily processes, costing you money and even causing you to lose customers until it’s back up and running again. Thankfully, Pandora FMS can help you prevent it from happening, and in the worst-case scenario when it does, you have the tools to get back up and running again in no time with our server monitoring solution!

How to Create SQL Percentile Aggregates and Rollups With Postgresql and t-digest

When it comes to data, let’s start with the obvious. Averages suck. As developers, we all know that percentiles are much more useful. Metrics like P90, P95, P99 give us a much better indication of how our software is performing. The challenge, historically, is how to track the underlying data and calculate the percentiles. Today I will show you how amazingly easy it is to aggregate and create SQL based percentile rollups with Postgresql and t-digest histograms!