Operations | Monitoring | ITSM | DevOps | Cloud

Latest News

Logging Best Practices: From Simple to Space Age

It is tempting to consider logging as a simple, solved problem. We write a log, check our file and, boom, we’ve cracked it. Yet those of us who have sat up at three in the morning, trawling through log files over an unreliable SSH connection, know that this is simply not enough. As your system scales, so too must the sophistication of your tooling. Your logging best practices must be scalable and ready to support your efforts.

The Netdata Community Powered by NodeBB

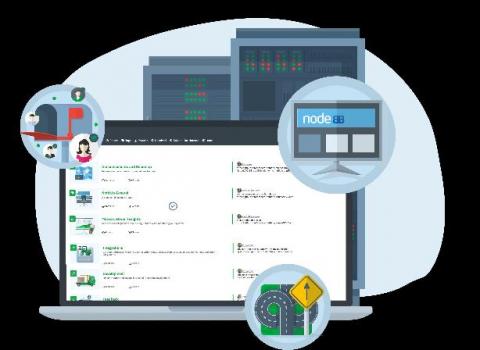
We recently adopted NodeBB as our software of choice for building the Netdata Community. We have many good reasons for why we wanted to provide our community with a proper home online, but I wanted to cover some of the technical reasons for choosing NodeBB for our platform, and the many parallels between the NodeBB and Netdata projects, which was certainly a driving force behind this decision.

In-house vs. MetricFire

You’re ingesting 20,000 data points a second, in 400,000 metrics, from thousands of AWS instances – and your monitoring can’t handle the load. You need a scalable, highly-available monitoring and dashboarding solution (and you need it yesterday). Should you do it yourself with an in-house Graphite or Prometheus monitoring system? Or will you skip the headache and choose a hosted service like MetricFire?

How a Financial Services Leader Gained Visibility with DEM

Maintaining digital performance has always been a tough balancing act for the Financial Services industry. Every transaction must be encrypted and secured; customer data must be stored safely without the risk of a breach. Security is given the highest priority, the additional processes in the service delivery chain can tax performance. Financial service providers must go the extra mile to ensure their network is resilient with high performance, availability, reliability, and reachability.

End-to-End Java Observability in 5 Simple Steps

Java is one of the most popular, flexible and useful programming languages with a very vibrant community to support it. Many of our customers use Java to create amazing applications, it’s an application on a single VM, or based on microservices running on Kubernetes. Naturally, we made it simple to understand the performance of Java-based applications using SignalFx Microservices APM.

New free tool alert! Try the HTTP Response Header Check

We did it again. We just published a new free tool, the HTTP Response Header Check. This handy little gadget quickly grabs your HTTP response headers for your review. It sounds simple because it is. But as every good DevOps pro knows, it is always a good idea to check your headers from time to time.

10 filter patterns that are helpful for managing your logs

Log files, which are the records of everything that has happened in your server, application, or framework, are generally unfiltered and huge. Going on for pages, these plain text files are packed with tons of information and are the initial go-to place for any troubleshooting. However, the challenge lies in reading, understanding, and interpreting log files, and ultimately pulling out the right piece of information required for analysis.

Scaling Prometheus: How we're pushing Cortex blocks storage to its limit and beyond

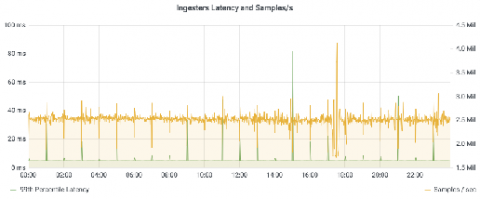
In a recent blog post, I wrote about the work we’ve done over the past year on Cortex blocks storage. Cortex is a long-term distributed storage for Prometheus. It provides horizontal scalability, high availability, multi-tenancy and blazing fast query performances when querying high cardinality series or large time ranges.