Operations | Monitoring | ITSM | DevOps | Cloud

Latest News

Jaeger Turns Five: A Tribute to Project Contributors

August 3rd, 2015 was the date of the first commit in the internal Jaeger repository at Uber. Technically, the true birthday of the project was probably a week or so earlier, because while I was prototyping the collector service we went through a number of project names, some of them rather embarrassing to name here, and the real first commits happened in a differently named repository.

OpsRamp Industry Recognition: ITOM, Infrastructure Monitoring, AIOps

In the first two quarters of 2020, OpsRamp has received market recognition from four independent analyst firms: Gartner, 451 Research, IDC, and Digital Enterprise Journal (DEJ). Leading media publications (CRN, Forbes, and ITOps Times) have also covered OpsRamp’s capabilities for cloud management, hybrid monitoring, and IT incident management.

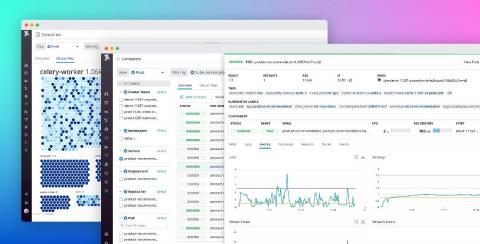
Explore Kubernetes resources with Datadog Live Containers

Running Kubernetes applications requires visibility into not only the overall performance of clusters but also the health of individual pods, deployments, and other resources that make up your environment. Datadog already integrates with your containerized environments and includes features like the Live Container view and the Container Map, enabling you to easily monitor Kubernetes and container runtime performance in real time and get deep visibility into clusters.

Introducing the Grafana Accelerator Program, one of the investments we're making in the community after raising $50 million

This morning, we announced that we raised $50 million in Series B funding. This additional funding, following our $24 million round last October, will enable us to dramatically accelerate research and development at Grafana Labs. We plan to hire more engineers and focus on product innovation. And importantly, it will help us continue to nurture and grow our community of millions of developers around the world.

Identifying and Resolving a Kafka Issue With AppSignal

Last week, we had an issue with one of our Kafka brokers. Don’t worry, it didn’t impact any customers. When monitoring things closely, you can often solve things before they impact a customer ;-). In today’s post, I’ll show you how we use AppSignal to dogfood our own issues. I’ll go through how we monitor the non-Ruby part of our stack and how we used AppSignal to detect and resolve the issue.

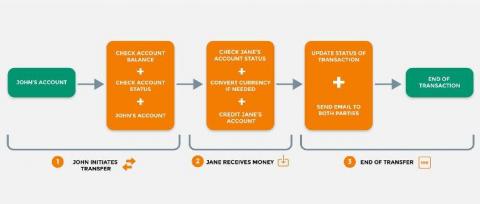
Understanding Database Transactions in Rails

Few things are scarier than a database slowly losing integrity over weeks or years. For a while, nobody notices anything. Then users start reporting bugs, yet you can't find any code that's broken. By the time you realize the problem, it may be happening for so long that your backups are unusable. We can avoid problems like these with skillful use of transactions.

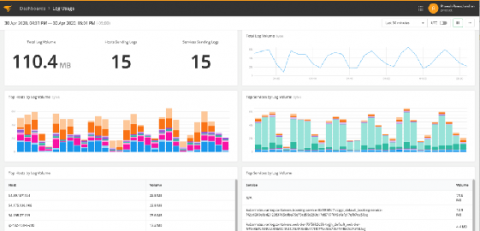
New Volume Reporting and Alerting Feature Announcements

We’re excited to announce the new Log Usage Dashboard designed to provide greater visibility into your log data volume consumption. This dashboard gives you in-depth visibility into your total log volume usage, so you can better manage—and optimize—your plan usage.

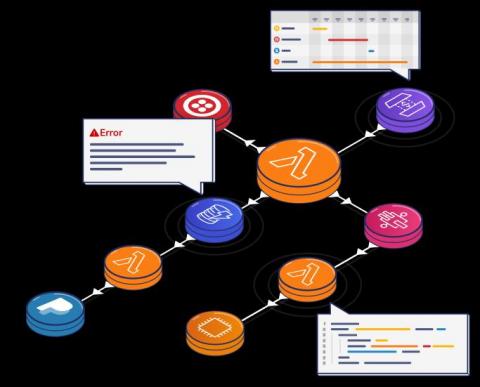
What alerts should you have for serverless applications?

A key metric for measuring how well you handle system outages is the Mean Time To Recovery or MTTR. It’s basically the time it takes you to restore the system to working conditions. The shorter the MTTR, the faster problems are resolved and the less impact your users would experience and hopefully the more likely they will continue to use your product! And the first step to resolve any problem is to know that you have a problem.